Figure 2.
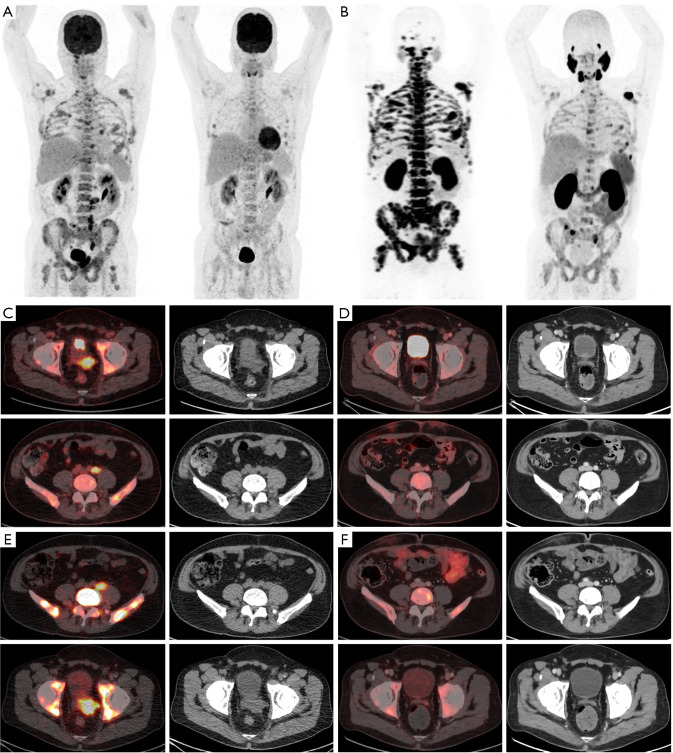
Imaging results at diagnosis and through the course of treatment. FDG PET-CT (A) and PSMA PET-CT (B) whole-body scans showing the comparison of the metabolically active metastases before (on the left) and after 6 cycles of chemotherapy with an addition of GnRH antagonist (on the right). FDG PET-CT (C,D) and PSMA PET-CT (E,F) scans with concomitant CT scans: at the diagnosis (C,E) and re-staging after 6 cycles of chemotherapy with etoposide/carboplatin with an addition of GnRH antagonist (D,F). FDG PET-CT, fluorodeoxyglucose positron emission tomography-computed tomography; PSMA, prostate-specific membrane antigen; GnRH, gonadotrophin-releasing hormone.

