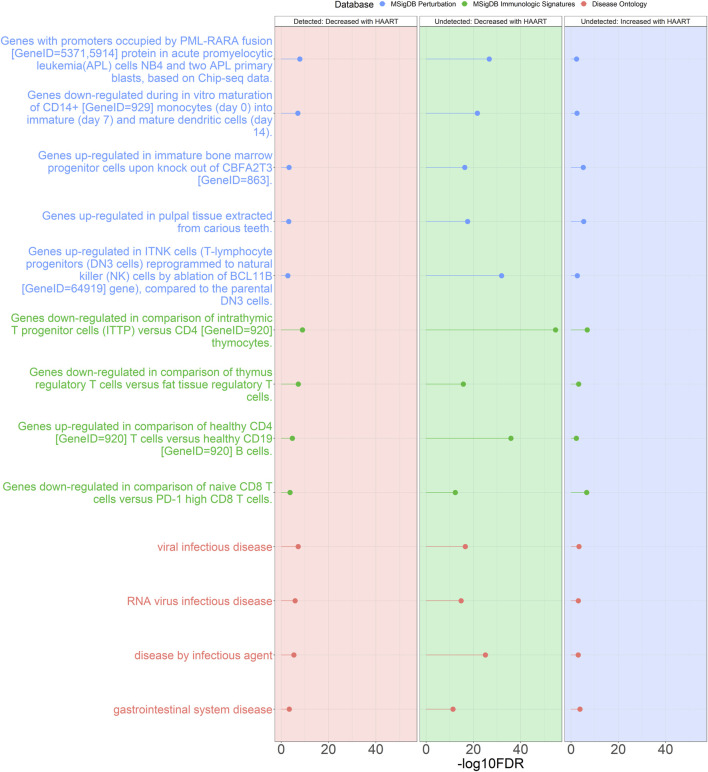
FIGURE 6.
Genomic Regions Enrichment of Annotations Tool for annotations shared between Undetected and Detected PLWH groups. GREAT results for shared annotations between the Undetected and Detected HAART-related CpG GREAT results. Depicted are the Detected group negatively correlated HAART-related CpGs (red background), Undetected group negatively correlated HAART-related CpGs (green background), and Undetected group positively correlated HAART-related CpGs (blue background). The criteria for selecting these annotations were annotations that were shared between at least three sets of GREAT results that were also within the top two most significant results from each set. The significant annotations (y-axis) are plotted against the -log10 FDR-adjusted hypergeometric p-value (x-axis). The ontology databases are grouped by color.

