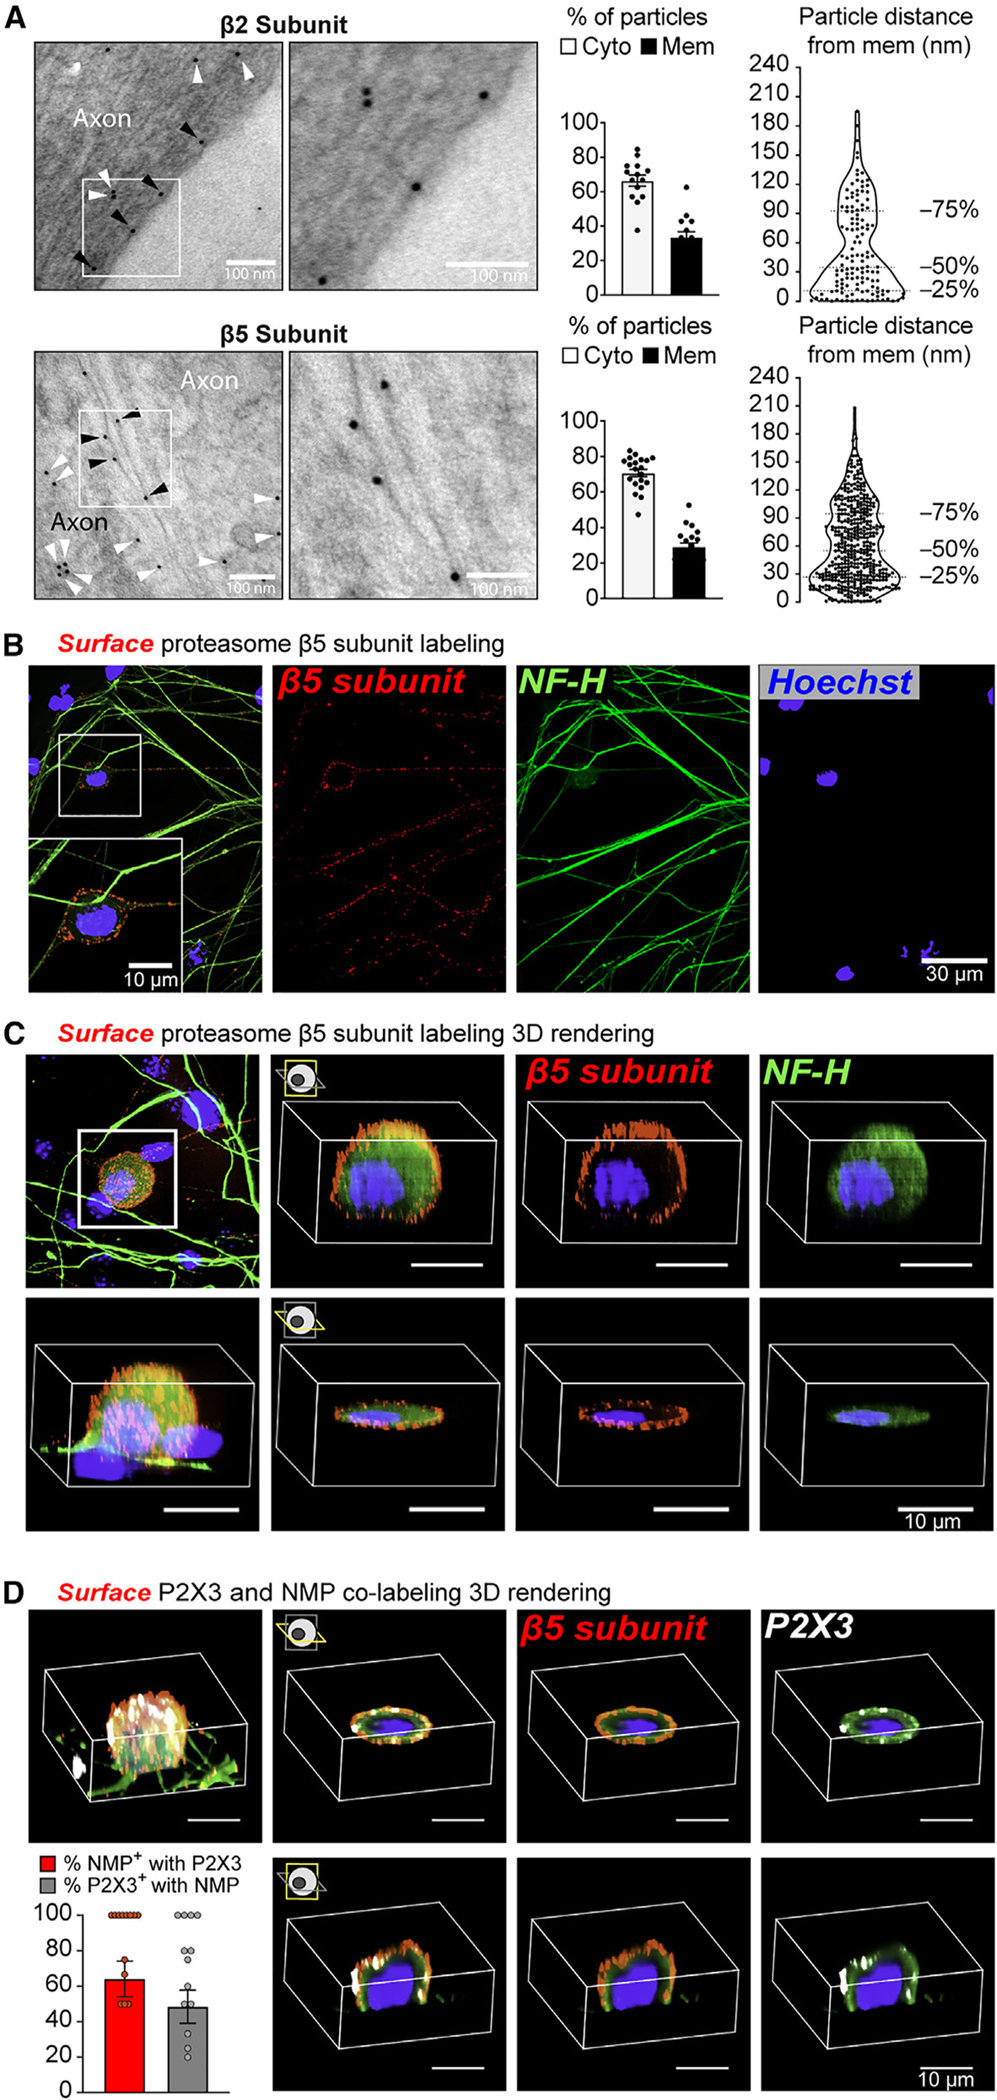
Figure 4. The NMP is enriched in specific subtypes of DRG neurons.

(A) Representative micrographs of immuno-EM labeling on primary DRG cultures. White arrowheads: gold particles localized on the cytoplasm. Black arrowheads: gold particles localized on the membrane. Bar graphs to the right show the proportion of gold particles localized on the cytoplasm (Cyto) and membrane (Mem). Violin plots show the distribution of gold particles within 240 nm of the neuronal membranes. Data are presented as mean ± SEM (n = 14–20 micrographs analyzed from two independent animals).
(B) Representative images of antibody feeding experiments in DRG cultures against the β5 proteasome subunit followed by cytoplasmic NF-H staining. White box: magnified section shown on bottom of composite image.
(C) Representative 3D projection images of antibody feeding experiments in DRG cultures against the β5 proteasome subunit followed by cytoplasmic NF-H staining.
(D) Representative 3D projection images of antibody feeding experiments in DRG cultures against the P2X3 and β5 proteasome subunit co-labeling. Bar graph shows quantification of surface P2X3 and β5 co-labeling under the conditions that at least one neuron in the field of view was positive for both NMP and P2X3. Data are presented as mean ± SEM (n = 13 images analyzed).
See also Figure S4.
