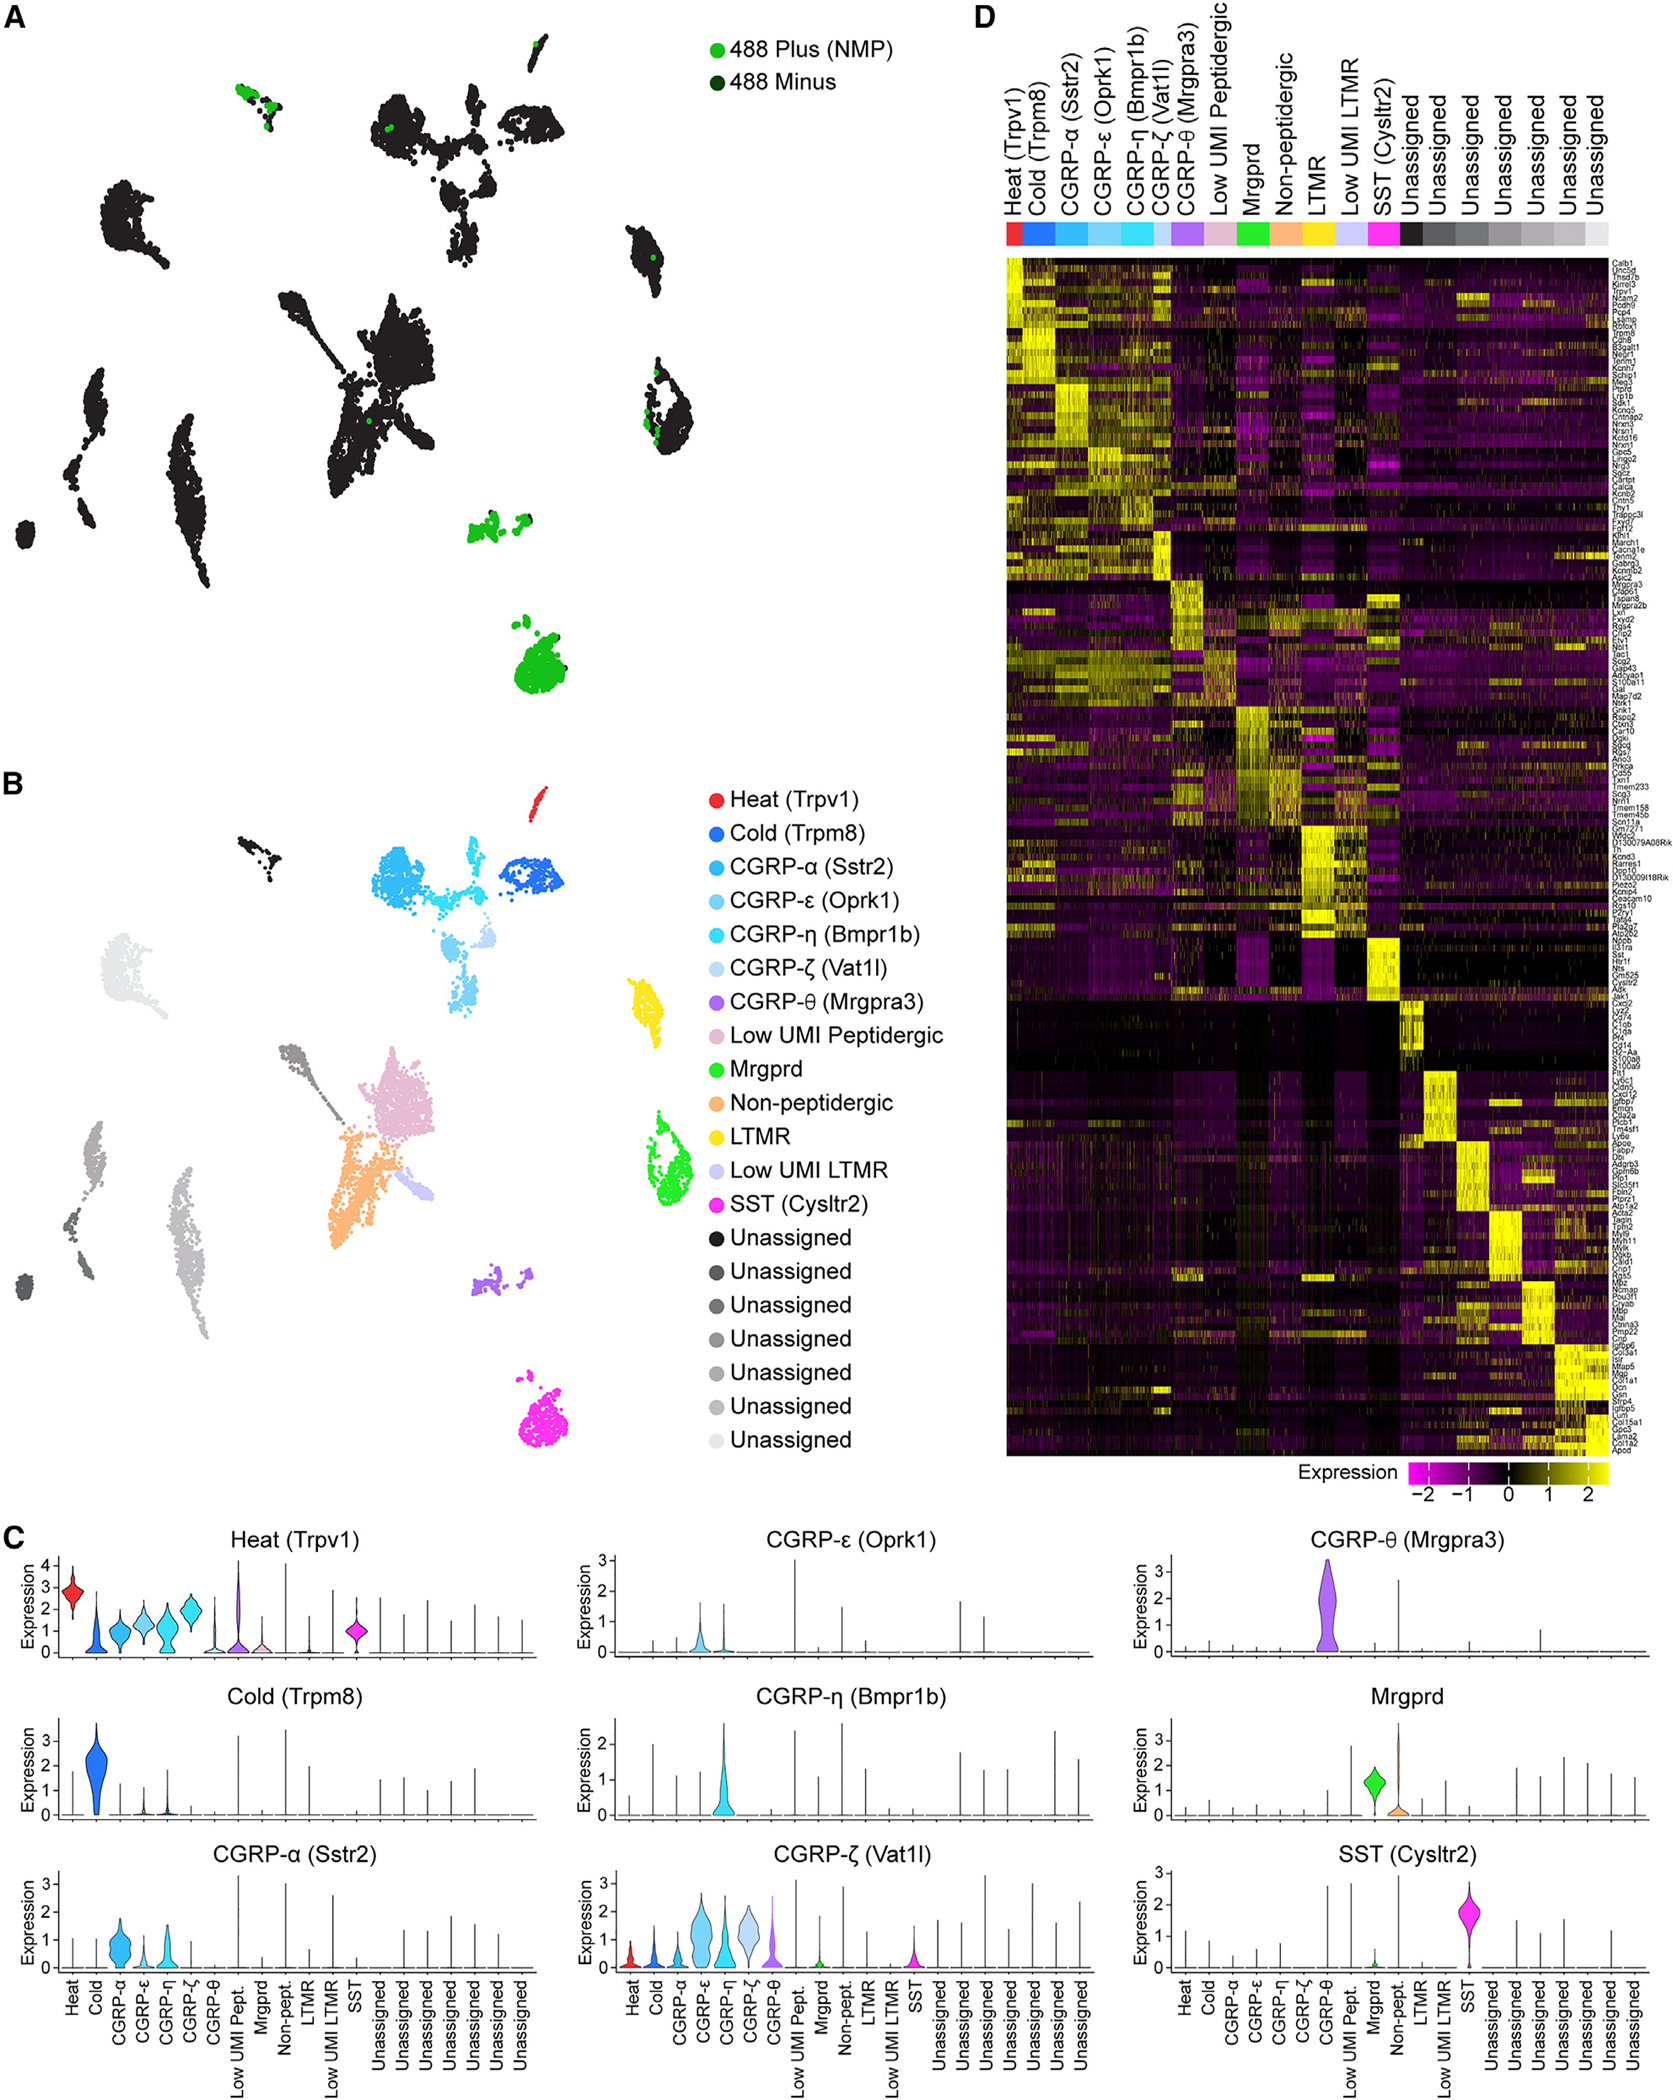
Figure 6. Transcriptional characterization of NMP-positive DRG neurons.

(A) UMAP visualization of scRNA-seq analysis of NMP-positive (green) and NMP-negative (black) neurons showing cell clusters of putative different DRG neuronal subtypes.
(B) UMAP showing identification of 13 cell clusters as distinct sensory neuronal subtypes and 7 unassigned clusters using previously defined gene sets.94,95 UMAP legend shows the marker gene that can be used to identify the different sensory neuronal subtype clusters.
(C) Violin plots showing expression profile of the marker genes that identify the different neuronal subtypes.
(D) Heatmap showing up to ten differentially expressed genes that specifically map to each cluster and can be used to identify the different sensory neuronal subtypes. Differential expression was performed by comparing each cluster to all other cells in the dataset using a Mann-Whitney U test. Genes were selected by fold change. Expression scale is shown below the heatmap. A random selection of up to 200 cells was selected in clusters with more than 200 cells to allow for visualization of gene expression patterns in smaller clusters.
