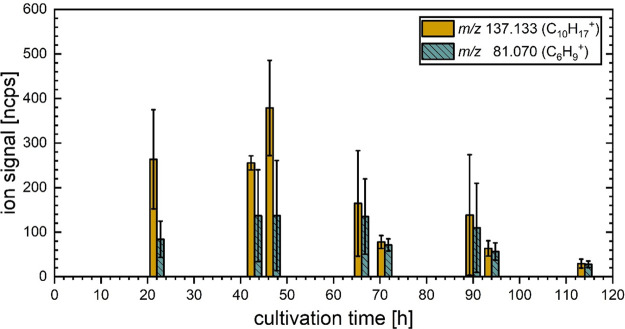
Figure 4.
Changes in the product ion signals at m/z 81.070 and 137.133 arising from cultures of T. atroviride at fixed measurement points during the five-day cultivation period. The bar graph and error bars indicate the average value and standard deviation between four independent biological replicates, respectively.

