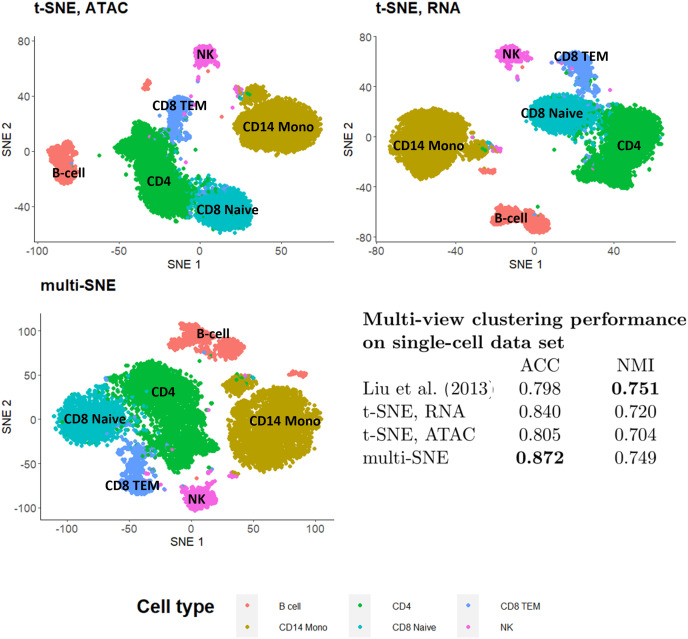
Figure 12. Visualisations and clustering performance on single-cell multi-omics data.
Projections produced by t-SNE on RNA, ATAC and multi-SNE on both data-views with perplexity for the two t-SNE projections and for multi-SNE. The clustering performance of the data by Liu et al. (2013), t-SNE and multi-SNE are presented.

