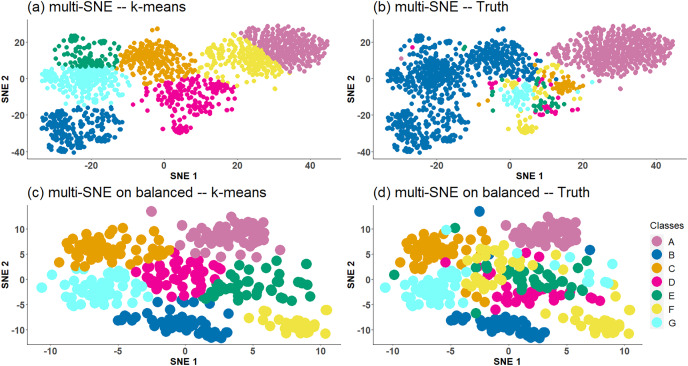
Figure 5. Multi-SNE visualisations of caltech7 and its balanced subset.
Projections produced by multi-SNE with perplexity and for the original and balanced caltech7 data set, respectively. Colours present the clustering on the data points by (A, C) K-means, and (B, D) Ground truth. (A, B) present the data points on the original caltech7 data set, while (C, D) are on its balanced subset.

