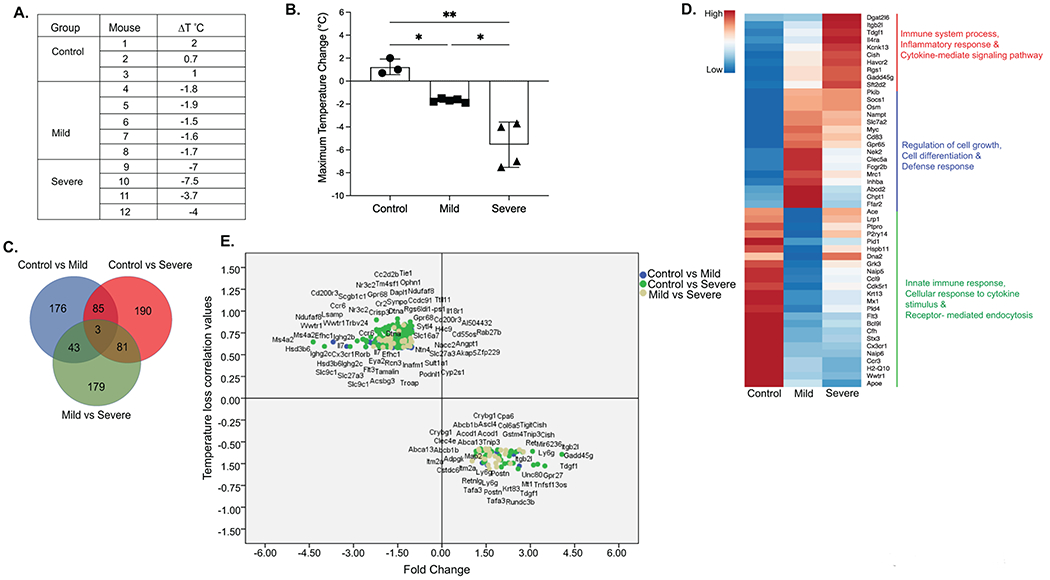
Figure 2: A. Whole blood differentially expressed genes associated with severity of IgE-mediated food allergy in mice.

A. Description of Anaphylaxis groups, treatment and Maximum temperature change (ΔT°C) in mice. B. Graphical representation of Maximum temperature change (ΔT°C) in iIL9Tg mice immunized with anti-TNP-IgE and subsequently received oral gavage OVA-TNP. Data represents mean ± SD of Maximum temperature change in mice 30 minutes following o.g. OVA-TNP. Symbols represents individual mice. * p<0.05, **p<001, ***p<0001. C. Venn diagram showing common and unique differential expressed genes (DEGs) from Pairwise differential gene expression analyses between Control vs Mild, Mild vs Severe and Control vs Severe groups (FC > 2, p < 0.05). D. Heatmap showing top 50 dysregulated genes in all the conditions. Biological processes for group specific genes extracted using DAVID analyses. E. Scattered plot showing FC of DEGs (FC > 2, p < 0.05) that correlated with Maximum temperature change (ΔT°C). Color code describes genes identified by group comparisons.
