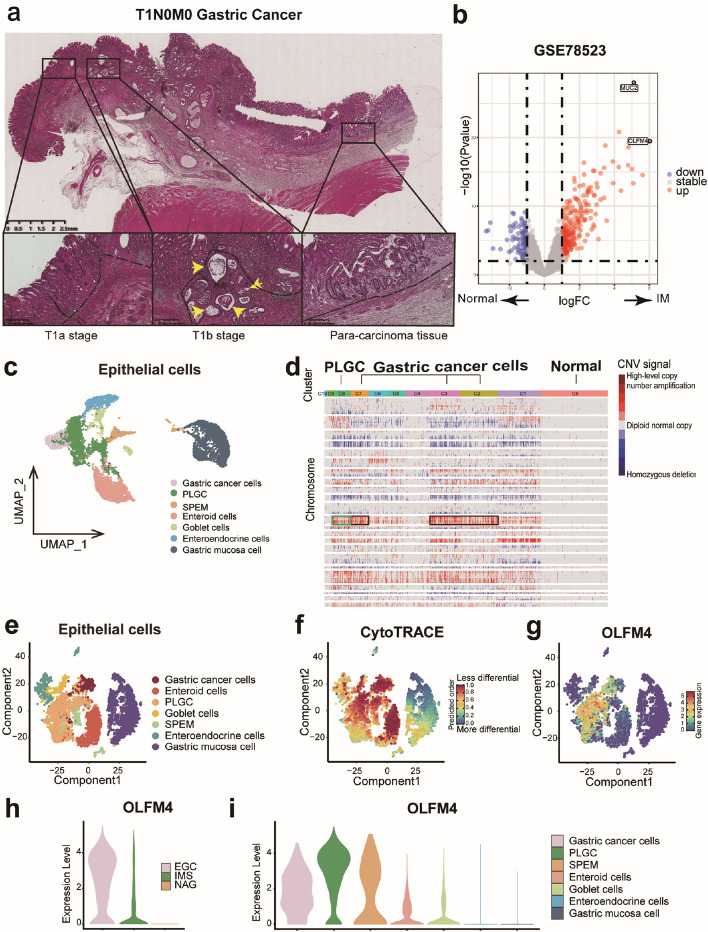
Fig. 1.
OLFM4 was the remarkable DEG in PLGC cells: a HE staining of pathological sections in T1N0M0 stage gastric cancer: Intestinal metaplasia lesions co-occurring with gastric cancer infiltration throughout the mucosal layer (left), infiltration that broke through the basement membrane and invaded the submucosa (middle), and normal adjacent glandular epithelium with accompanying intestinal metaplastic lesions (right). Key indicators: The Black dashed line represented the basement membrane, and the yellow arrow highlighted gastric cancer invading the basement membrane with intestinal metaplasia. b Volcano plot from GSE78523 highlighting the top two DEGs, OLFM4 and MUC2, in intestinal metaplasia tissues. c Cluster analysis of epithelial cells in GSE134520. d Analysis of CNV in epithelial cell subgroups using inferCNV. e–g Assessment of the differentiation of epithelial cell subgroups with Cytotrace. h-i Evaluation of OLFM4 expression in tissues and cell subgroups. IM: Intestinal metaplasia, EGC: Early gastric cancer, IMS: Sever intestinal metaplasia, NAG: non-atrophic gastritis, SPEM: Spasmolytic polypeptide expressing metaplasia, PLGC: Precancerous lesions of gastric carcinoma

