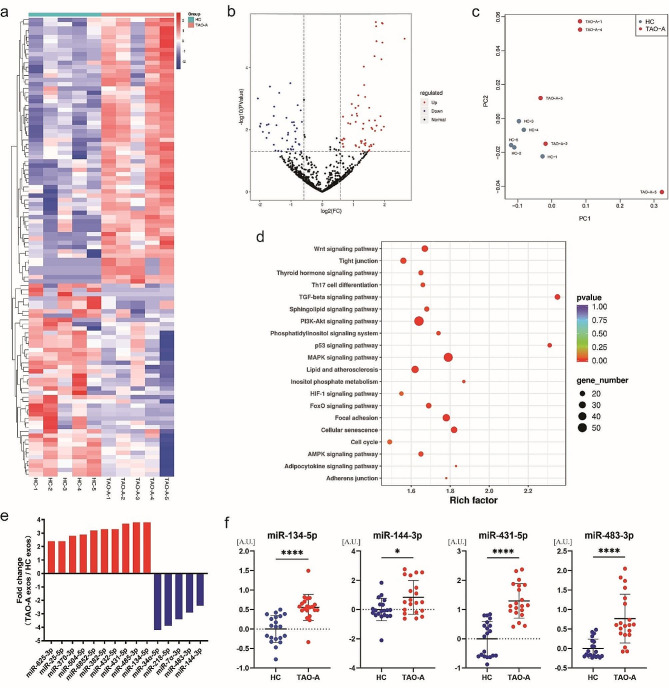
Fig. 5.
The exosomal miRNA profiles of patients with active TAO differed from those of healthy controls. (a) Heatmap of the miRNA expression profiles in Pla-Exos in HC and TAO-A groups. Exosomes were isolated from the same plasma samples used in the functional analysis. RNA-seq was used for miRNA content analysis. (b) Volcano plot comparing miRNAs in Pla-Exos from patients with active TAO and HCs. The volcano plot was created using a log2 fold change and –log10 p values of all the detected miRNAs. (c) PC analysis for the active TAO patients and HC samples based on the miRNA expression profiles. (d) KEGG pathway analysis of DE-miRNA target genes identified 20 immune-related pathways. (e) The differently expressed trends of candidate miRNAs in RNA-seq data. (f) Levels of miR-134-5p, miR-144-3p, miR-431-5p, and miR-483-3p in Pla-Exos determined by RT-PCR and normalized to the expression levels of miR-30a-5p. n = 20 per group. PC principal component, KEGG Kyoto Encyclopedia of Genes and Genomes analysis, DE-miRNA differential expressed miRNA, A.U. arbitrary unit

