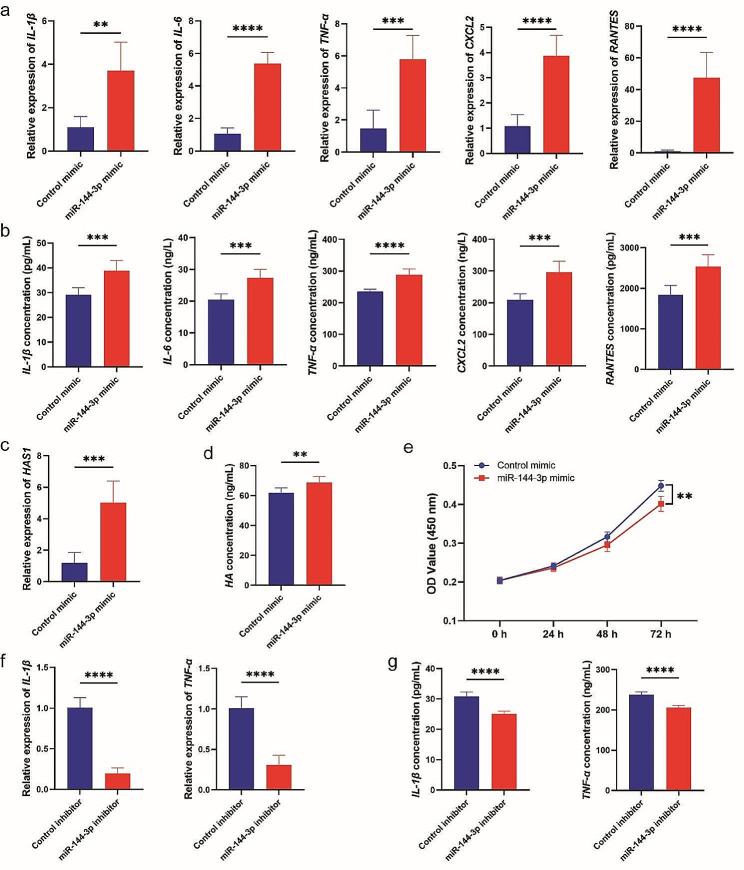
Fig. 7.
miR-144-3p induced Thy-1+ OFs dysfunction. (a, b) Levels of inflammatory molecules in Thy-1+ OFs treated with miR-144-3p mimics or control mimics. (c, d) Levels of HAS and HA in Thy-1+ OFs treated with miR-144-3p mimics or control mimics. (e) Cell proliferation of Thy-1+ OFs treated with miR-144-3p mimics or control mimics. (f, g) Levels of inflammatory molecules in Thy-1+ OFs treated with miR-144-3p inhibitors or control inhibitors. Error bars represent the mean ± SD. n = 6 per group. ns no significance, * p < 0.05, ** p < 0.01, *** p < 0.001 and **** p < 0.0001, student’s t test

