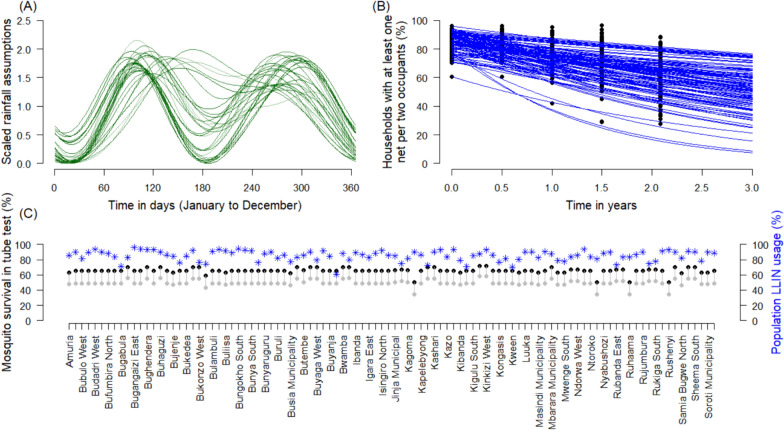
Fig. 2.
Variability in model parameters between simulated clusters. A Assumed and scaled seasonal profiles that determine mosquito densities in model simulations for each of 100 clusters in the model simulations. B Change in net use over time since the start of the mass campaign for each simulated cluster (sub-district noted alphabetically). Net use tends to drop over time, though the rate varies across sub-regions, as determined via cross-sectional surveys. Points indicate survey data from the trial (percentage of affirmative responses to question: were nets used the previous night). These data were used to fit a constant rate of net loss over time (Eq. 1, solid lines) for each health sub-district. The same net use patterns were assumed for the 2020–2021 campaign, for the respective sub-districts. C Model assumptions for the pyrethroid resistance (approximated as the proportion of surviving mosquitoes when tested in a discriminating dose tube bioassay exposing mosquitoes to pyrethroid insecticide) as of 2014 (grey points) and 2017 onward (black points). Assuming LLIN coverage immediately after the mass campaign (blue asterisk, right side axis)

