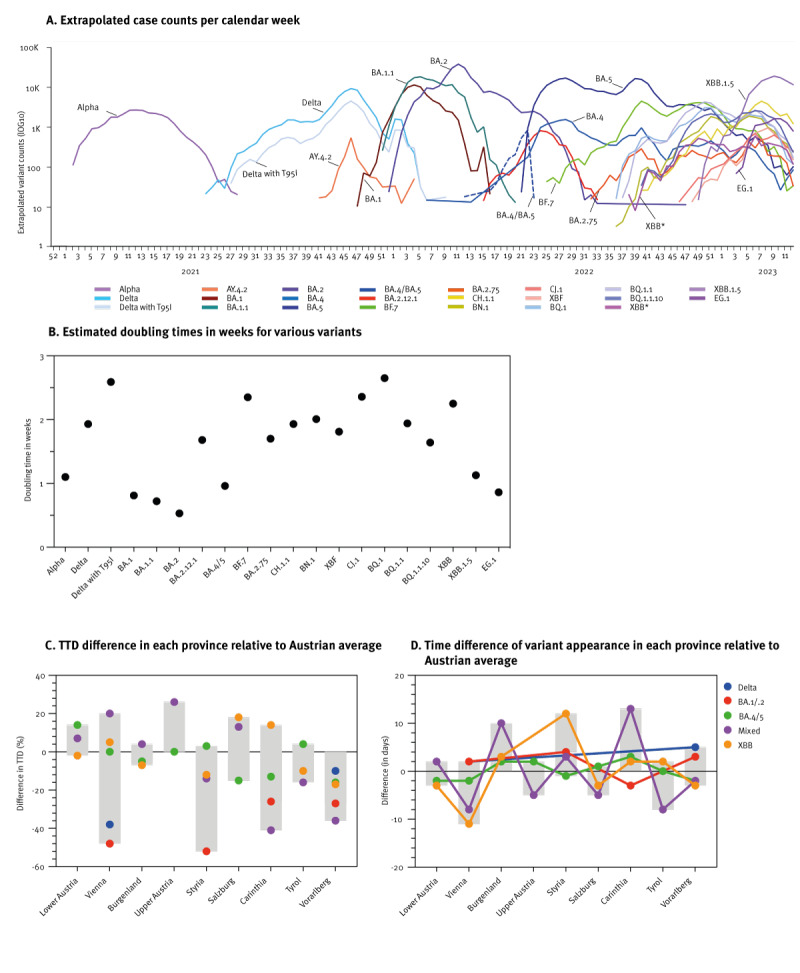
Figure 3.
Dynamics of major SARS-CoV-2 variants in Austria and Austrian provinces, January 2021−March 2023
Alpha: Pango lineage designation B.1.1.7; Delta: Pango lineage designation B.1.617.2; SARS-CoV-2: severe acute respiratory syndrome coronavirus 2; TTD: time to dominance.
A. Extrapolated absolute case counts from Figure 2D in the logarithmic scale to illustrate differences in the initial growth dynamics.
B. Calculated doubling times in weeks for various variants based on curve fitting (Figure S14 of Supplementary Material). BA.4 and BA.5 were analysed combined as BA.4/5, due to the limited number of samples for BA.4.
C. Per cent difference in TTD for each province compared with Austria. TTD is defined as the time from 10% to 60% prevalence using fitted curves (Figure S16 and Supplementary Table 4, TTD). The results are presented in days, with negative values indicating less time than Austria, and positive values indicating more time than Austria.
D. Variant appearance as defined by 10% prevalence in each province relative to the Austrian average based on the fitted curves (Figure S16 and Supplementary Table 4, Variant appearance). Negative values indicating an earlier appearance time and positive values indicating a later appearance time.
For analysis in C. and D. we defined variants with convergent mutations; BA.2.75, BN.1, CH.1, CJ.1, XBF, BQ.1, BQ.1.1, and BQ.1.1.10 as ‘mixed’ variants. Due to the limited number of samples for BA.1/BA.1.1/BA.2 as well as BA.4/BA.5 across all Austrian provinces, variants were analysed combined as BA.1/2 and BA.4/5 respectively.

