
Figure 4.
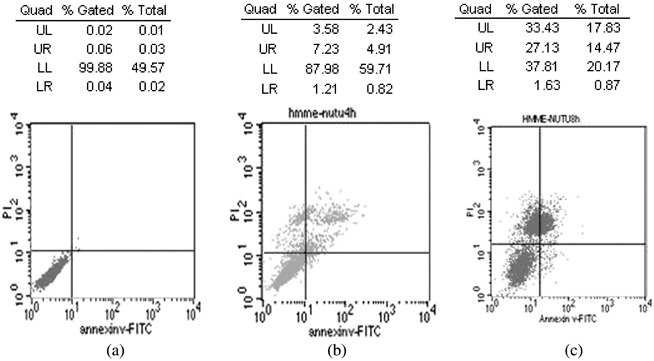
Cell death mode induced by hematoporphyrin monomethyl ether‐based photodynamic treatment (PDT). Flow cytometry analysis of NuTu‐19 cancer cells, derived from adenocarcinoma of Fischer 344 rat. with Annexin V/propidium iodide (PI) double staining after PDT. (a) Controls; (b) 4 h after PDT; (c) 8 h after PDT. UL (upper left quadrant): Annexin V(–)∖PI(+), cell fragment; UR (upper right quadrant): Annexin V(+)∖PI(+), necrosis cells; LL (lower left quadrant): Annexin V(–)∖PI(–), survival cells; LR (lower right quadrant): Annexin V(+)∖PI(–), apoptotic cells.