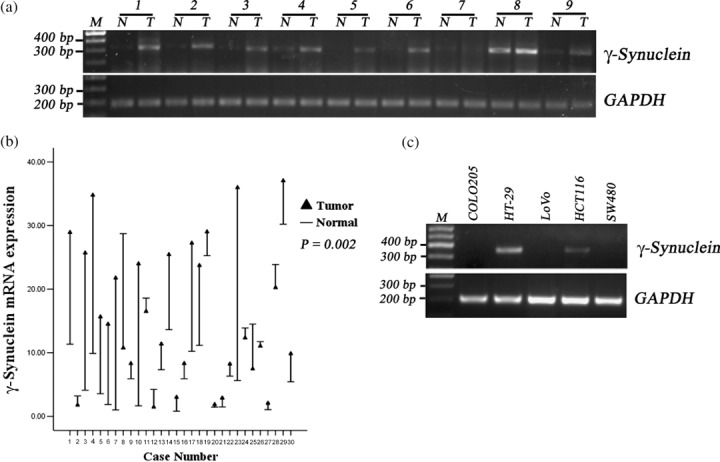
Figure 1.

Detection of γ‐synuclein mRNA in colorectal cancer (CRC) samples (T), non‐neoplastic adjacent tissues (NNAT) samples (N), and CRC cell lines. M, 100 bp Maker. (a) The results of reverse transcription–polymerase chain reaction (RT‐PCR) in nine of 30 pairs of samples. (b) Drop‐line graph compares γ‐synuclein mRNA expression detected by quantitative RT‐PCR in CRC versus NNAT samples (P = 0.002). (c) The results of RT‐PCR in CRC cells.
