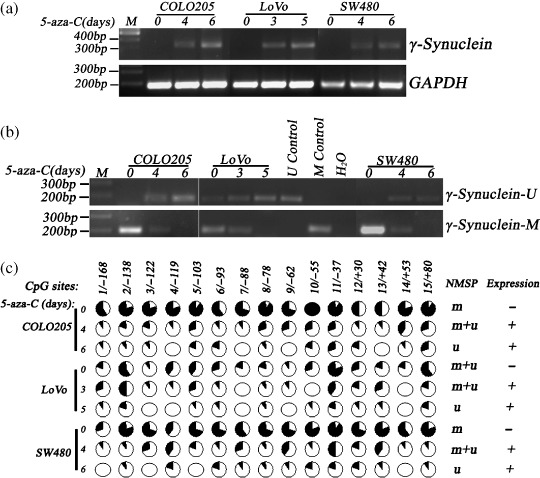
Figure 4.

Re‐expression of γ‐synuclein mRNA and changes in methylation status of γ‐synuclein CpG island in COLO205, LoVo, and SW480 cells after 5‐aza‐C treatment. M control, methylated control; m + u, partially unmethylated; M, 100 bp Maker; m, completely methylated; U control, unmethylated control; u, completely unmethylated; γ‐synuclein‐M, methylated polymerase chain reaction (PCR) product; γ‐Synuclein‐U, unmethylated PCR product. (a) reverse transcription–polymerase chain reaction (RT‐PCR) shows re‐expression of γ‐synuclein mRNA after the treatment. (b) Nested methylation‐specific PCR (NMSP) shows demethylation of γ‐synuclein after the treatment. (c) The results of genomic bisulfite DNA sequencing before and after the treatment. Each circle in the figure represents a single CpG site. For each DNA sample, the percentage of unmethylation at a single CpG site is calculated from the sequencing results of 10 independent clones.  , 100% unmethylation;
  , 0% unmethylation.
