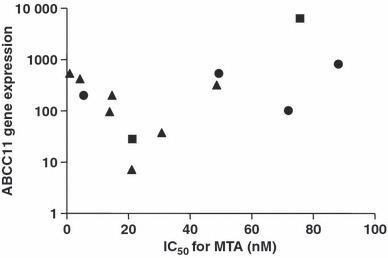
Figure 5.

Relationship between IC50 values for pemetrexed (MTA) and ABCC11 gene expression in 13 lung adenocarcinoma cell lines. Each symbol refers to the genotype of ABCC11. Closed circle (•), 538G/G; closed square (), 538G/A; closed triangle (), 538A/A. No significant correlation was observed between the ABCC11 gene expression levels and MTA sensitivity (n = 13, r = 0.2418, P = 0.4262).
