
Figure 6.
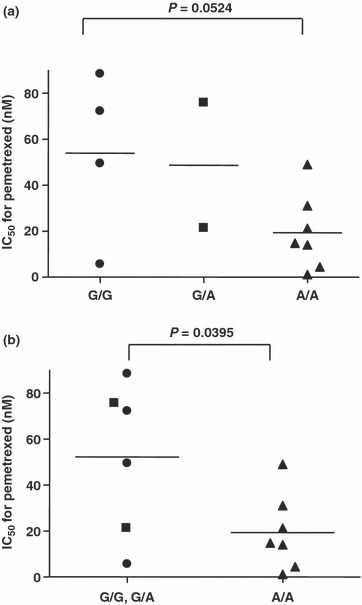
Distribution of IC50 values for pemetrexed (MTA) in 13 lung adenocarcinoma cell lines classified as ABCC11 538(G>A) SNP types. Closed circle (•), 538G/G; closed square (), 538G/A; closed triangle (), 538A/A. (a) Comparison of three genotype groups: 538G/G, 538G/A and 538A/A. (b) Comparison of the combined 538G/G and 538G/A groups and 538A/A group.