
Figure 3.
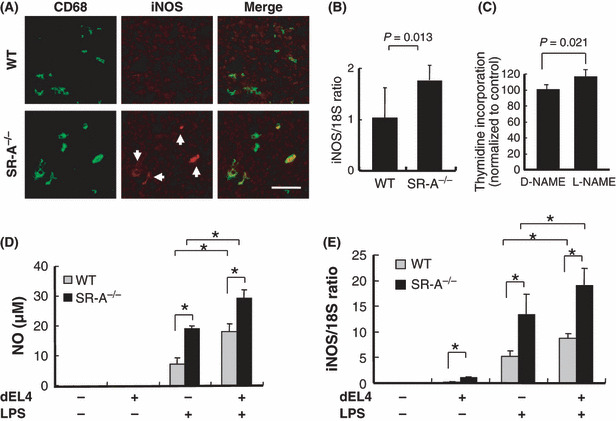
Nitric oxide (NO) and inducible NO synthase (iNOS) production in tumor‐associated macrophages (TAM). (A) Double immunofluorescent study of CD68 (green) and iNOS (red, arrows) in tumor sections from WT and SR‐A−/− mice. Scale bar = 50 μm. (B) Expression of iNOS mRNA in tumor tissues was calculated by means of real‐time PCR (n = 7 for each group). (C) Proliferation assay of EL4 cells cocultured with bone marrow‐derived macrophages from SR‐A−/− mice was carried out in the presence of iNOS inhibitor (N G‐Nitro‐l‐arginine methyl ester [l‐NAME], 10 μm). (D) NO production in cultured macrophages. After macrophages were cultured with dead EL4 (dEL4) cells and LPS for 24 h, NO production in the supernatant was evaluated via the Griess reaction. *P < 0.01 (n = 4 for each group). (E) After macrophages were cultured with dEL4 cells and LPS for 8 h, expression of iNOS mRNA was calculated by real‐time PCR (n = 4 for each group). *P < 0.01.