
Figure 4.
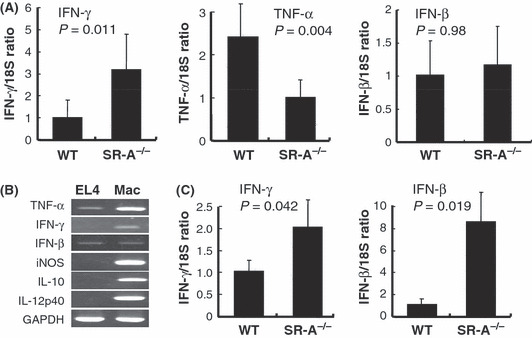
Cytokine expression in tumor tissues. (A) Quantitative real‐time RT‐PCR analysis for detection of interferon (IFN)‐β, IFN‐γ, and TNF‐α in EL4 tumors from WT and SR‐A−/− mice (n = 7 for each group). Relative values of these mRNA levels were normalized with respect to endogenous control 18S rRNA gene expression. (B) RT‐PCR results for TNF‐α, IFN‐γ, IFN‐β, iNOS, IL‐10, IL‐12p40, and GAPDH in cultured EL4 cells and macrophages stimulated with LPS. (C) EL4 cells were injected into the peritoneal cavity. Seven days later, tumor‐associated macrophages (TAM) were isolated from ascites by using F4/80 and secondary antibody‐coupled magnet beads. Quantitative real‐time RT‐PCR analysis for detection of IFN‐γ and IFN‐β and in purified TAM from ascites of WT and SR‐A−/− mice (n = 4 for each group).