
Figure 5.
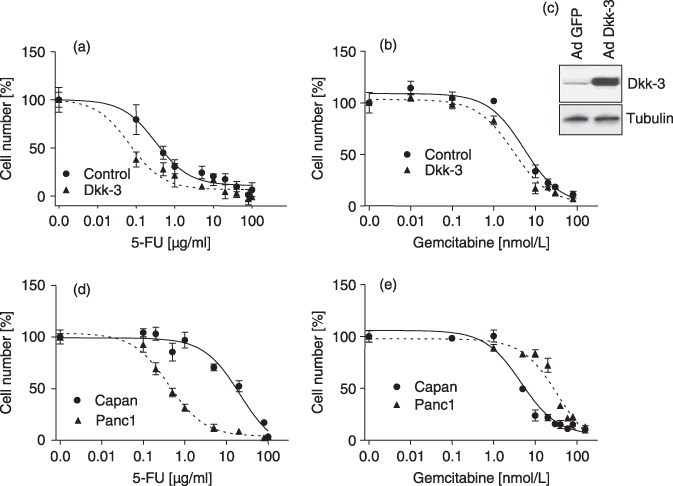
Dose–response analysis of HUVEC after (a) 5‐fluorouracil (5‐FU) and (b) gemcitabine treatment, respectively. Dkk‐3‐overexpressing endothelial cells and Green Fluorescent Protein (GFP)‐control cells were treated with different concentrations of 5‐FU or gemcitabine for 48 h. Thereafter, cell number was determined and expressed as percentage of control. Dkk‐3 overexpression significantly sensitizes endothelial cells to 5‐FU and gemcitabine treatment. Using 5‐FU, IC50 was 0.08 µg/mL for Dkk‐3 overexpressing cells and 0.49 µg/mL for control cells, respectively (P = 0.005). For gemcitabine IC50 values were 2.94 nmol/L and 5.87 nmol/L, respectively (P = 0.0015). (c) Western blot analysis of Dkk‐3 in EC transfected with GFP‐ (Ad‐GFP) or Dkk‐3 (Ad‐Dkk‐3) adenovirus. High Dkk‐3 expression was found only in Dkk‐3‐transfected cells. Tubulin was used as internal loading control. (d,e) Dose–response analyses of pancreatic carcinoma cell lines were done in a similar manner to that for EC. IC50 for 5‐FU treatment was 0.42 µg/mL for Panc‐1 and 21.13 µg/mL for the Capan‐1 cell line. After gemcitabine application the IC50 was 4.62 nmol/L for Capan‐1 and 45.86 nmol/L for the Panc‐1 cell line. Comparison of IC50 between Dkk‐3‐transfected EC and cancer cell lines demonstrated a significant lower IC50 for EC than for Panc‐1 after 5‐FU treatment (P = 0.0092) and a significant lower IC50 compared to Capan‐1 after gemcitabine treatment (P = 0.012).