
Figure 4.
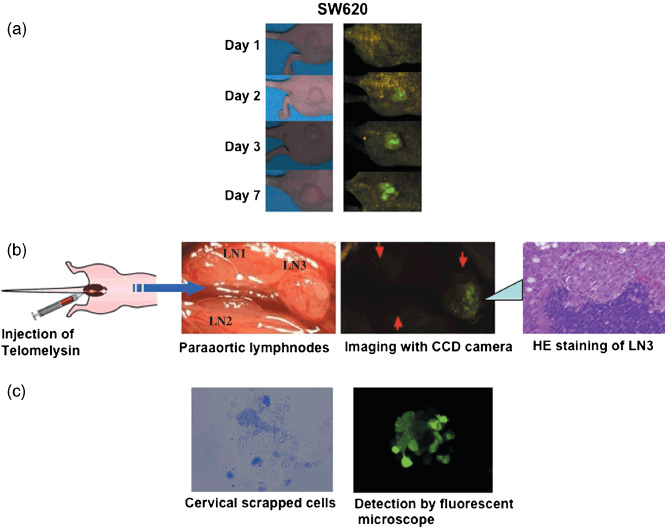
Diagnostic utility of TelomeScan. (a) Visualization of tumor by the injection of TelomeScan. Subcutaneous tumor xenografts by colon cancer (SW620) were directly injected by TelomeScan at concentrations of 8 × 10⁶ PFU. The green fluroescent protein (GFP) fluorescence intensity was monitored for seven consecutive days under the cooled charged‐coupled device (CCD) imaging system. Left panels, macroscopic appearance of subcutaneous tumors; right panels, fluorescence detection. A modified version of this figure appeared in our original article.( 114 ) (b) Selective visualization of lymph node metastasis by TelomeScan in orthotopic xenografts model. The rectums of mice were implanted with mouse rectal cancer HT29 cells. TelomeScan was directly injected into implanted tumor at a concentration of 1 × 10⁸ PFU. At 5 days after the injection, mice were assessed for lymph node metastasis by laparotomy. Three swelled para‐aortic lymph nodes were identified (LN1, LN2, and LN3). Internal imaging with the optical CCD camera showed one of the three nodes with GFP fluorescence (LN3), while the other lymph nodes (LN1, LN2) did not show (arrowheads indicate the position of swelled lymph nodes). Hematoxylin–eosin staining of lymph node sections revealed the apparent metastasis in LN3, while no metastatic sites were identified in LN1 or LN2 (data not shown), indicating that GFP fluorescence by the replication of TelomeScan is a potential biomaker of lymph node metastasis. A modified version of this figure appeared in our original article.( 115 ) (c) Application of TelomeScan to visualization of cervical cancer cells in cytological samples. Uterine cervical scraping cells from patients with cervical cancer were incubated with TelomeScan at 10 MOI for 24 h, and then observed under light microscopy (left panel) or fluorescent microscopy (right panel). Clusters with cellular atypia exhibit GFP fluorescence.