
Figure 6.
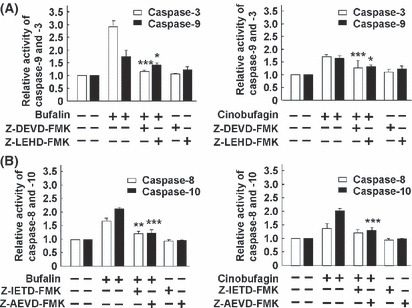
Effect of caspase inhibitors on caspase activities induced by bufalin or cinobufagin in HepG2 cells. (A) Relative activity of caspase‐9 and ‐3. (B) Relative activity of caspase‐8 and ‐10. The data represent mean ± SD (n = 3). *P < 0.05, **P < 0.01 and ***P < 0.001 versus bufalin or cinobufagin groups in the absence of caspase inhibitors.