
Figure 1.
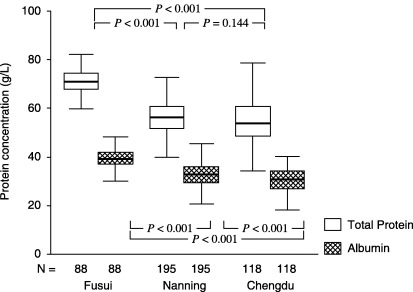
Comparison of plasma protein concentrations among 402 subjects in three regions of China. Box‐plot values were expressed as mean and range (g/L). P‐values are from multiple comparisons of the biomarkers’ levels in the three groups using one‐way ANOVA (LSD test).