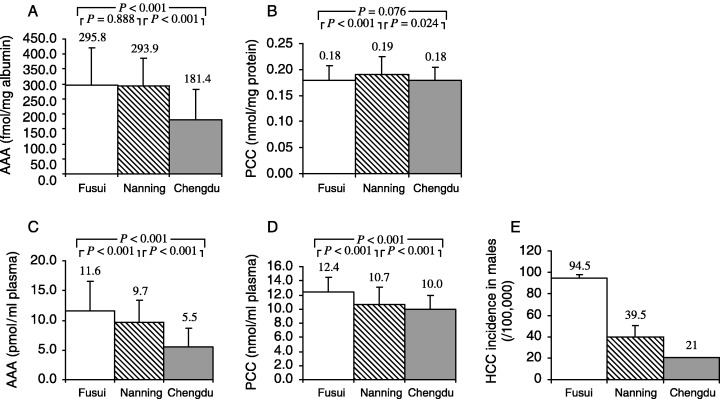
Figure 2.

Comparison of protein adduct levels among subjects from Fusui, Nanning and Chengdu and hepatocellular carcinoma (HCC) incidence in men in each region (one‐way ANOVA). Values are expressed as mean ± SD. (A–D) P‐values are from multiple comparisons of the biomarkers’ levels in the three groups in one‐way ANOVA (LSD test). (E) HCC incidence was obtained from local cancer registeries.( 15 ) AAA, aflatoxin B1–albumin adduct; PCC, protein carbonyl content.
