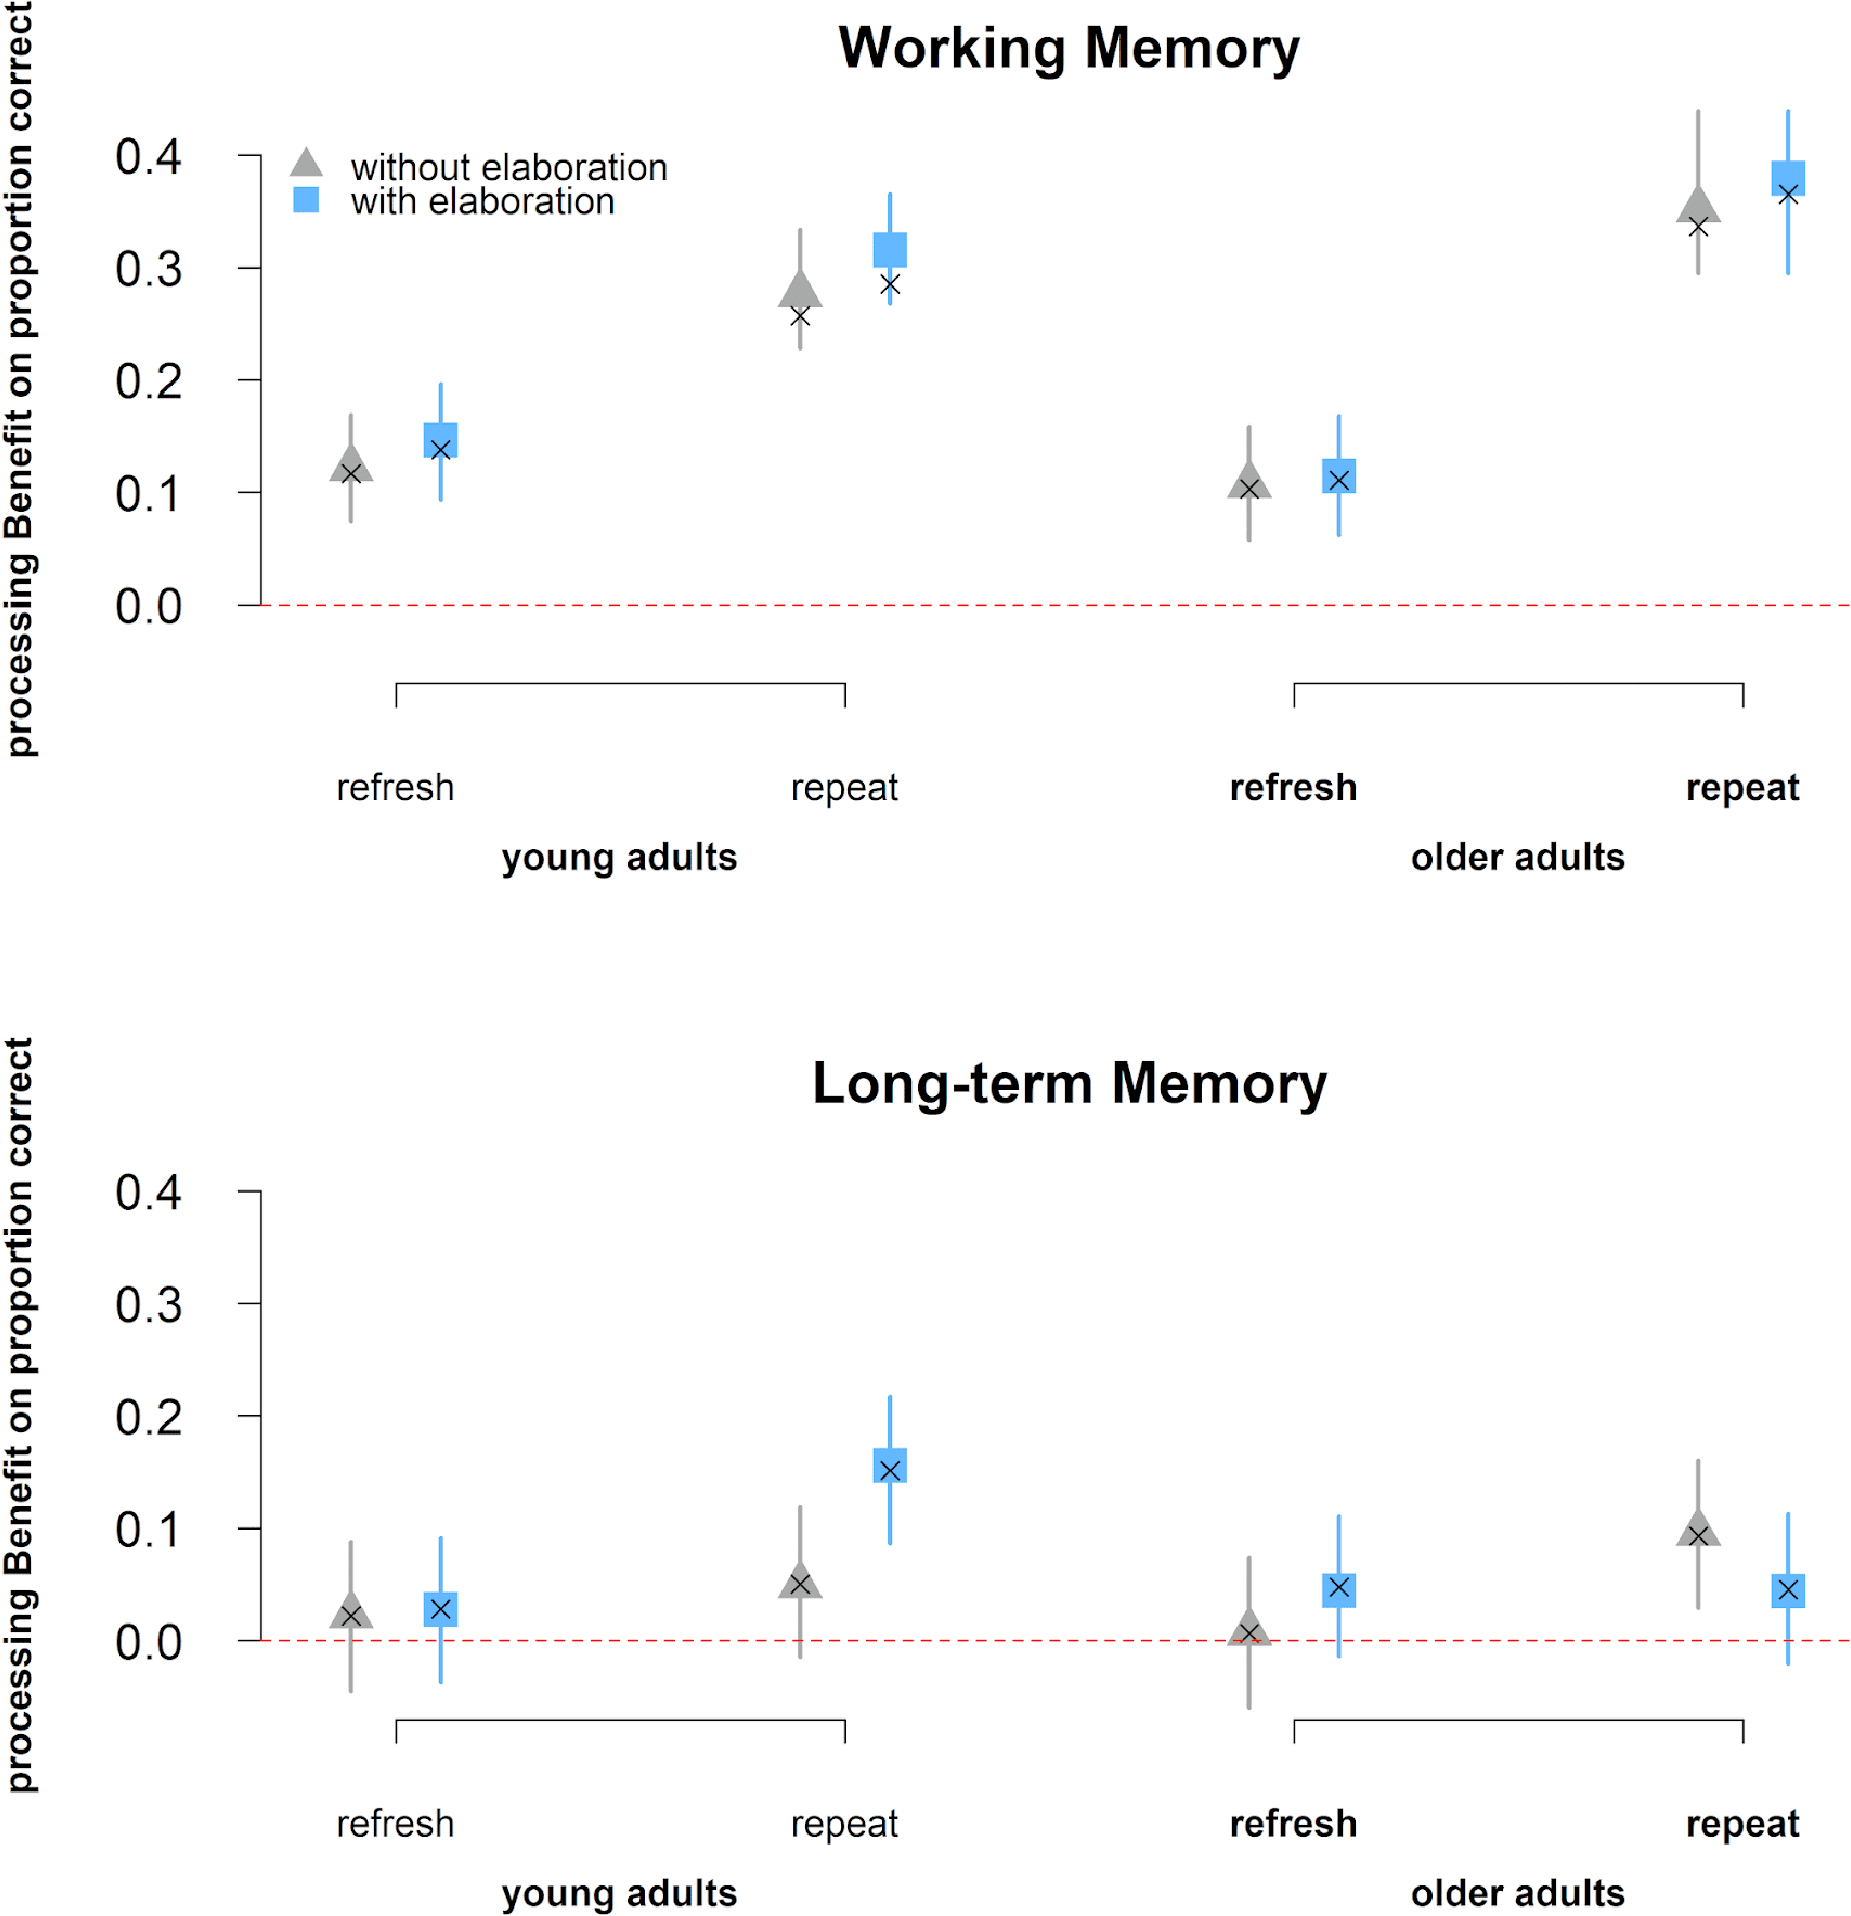
Fig. 2.

processing benefit in the WM (upper graph) and LTM (lower graph) task. The blue symbols and error bars represent estimated processing benefits and their 95% HDRs from the BGLMM for the conditions with elaboration, the grey symbols represent the same for the ones without elaboration. The crosses repre- sent the observed means. Their overlap indicates that the model adequately describes the data. The red line represents the point of no difference in performance between the processed and the unprocessed triplet.
