
Figure 2.
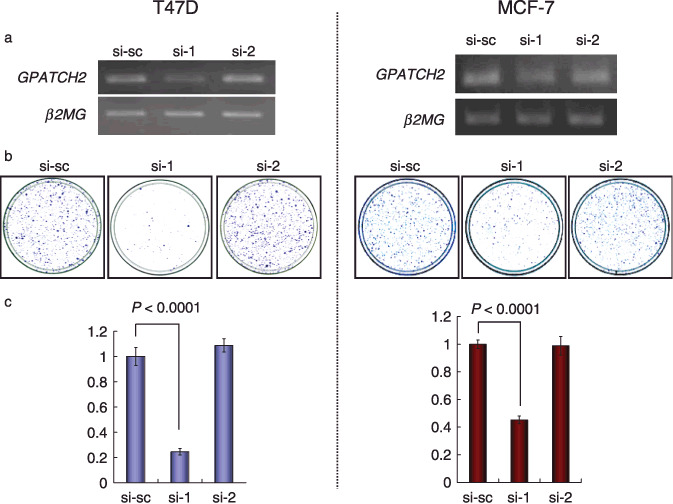
Growth‐inhibitory effects of G‐patch domain containing 2 (GPATCH2) siRNA on breast cancer cells. (a) Semiquantitative RT‐PCR showing suppression of endogenous expression of GPATCH2 by GPATCH2‐specific siRNA (si‐1 and si‐2) in the breast cancer cell lines T47D (left panels) and MCF‐7 (right panels). Scramble‐siRNA (si‐sc) was used as a negative control. β2‐microgloblin (β2MG) was used as a quantitative control for RT‐PCR. (b) Colony formation assay demonstrating a decrease in the numbers of colonies by knockdown of GPATCH2 in T47D (left panels) and MCF‐7 (right panels) cells. (c) MTT assay demonstrating a decrease in the numbers of cells by knockdown of GPATCH2 in T47D (left panel; si‐1 P < 0.0001; unpaired t‐test) and MCF‐7 (right panel; si‐1 P < 0.0001; unpaired t‐test) cells.