
Figure 1.
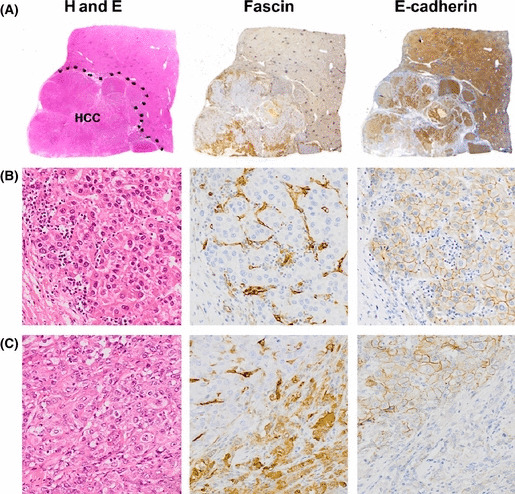
Serial sections of a poorly differentiated hepatocellular carcinoma (HCC) stained for H&E, fascin‐1 (fascin), or E‐cadherin. (A) Macroscopic views. The tumor area is illustrated by a dotted curve in the H&E section. Note that fascin‐1 and E‐cadherin expressions generally are mutually exclusive. The fascin‐1‐positive HCC cells tend to invade and replace the fibrous stroma or capsule. (B) Microscopic view of a minor, relatively well differentiated section of this tumor. The strongly fascin‐1‐positive endothelial cells highlight a typical trabecular pattern of the HCC with organized sinusoidal structure. All the HCC cells are negative for fascin‐1 but positive for E‐cadherin. (C) Predominant component of this tumor. Although the H&E section displays a solid growth of poorly differentiated tumor cells, fascin‐1 staining reveals sinusoidal structures with fascin‐1‐negative HCC cells in the upper left area. In contrast, the sinusoidal structure is lost due to invasive growth of fascin‐1‐positive HCC cells, as shown in the lower right area. Note that fascin‐1 and E‐cadherin have inverse staining patterns.