
Figure 2.
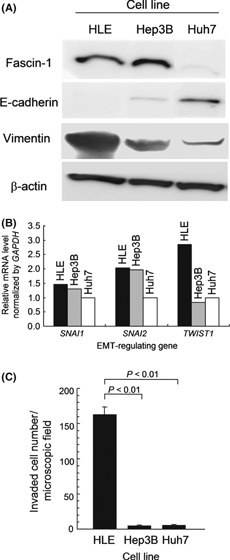
Characterization of human hepatocellular carcinoma cell lines HLE, Hep3B, and Huh7. (A) Western blot analysis. (B) Relative mRNA levels evaluated by semiquantitative RT‐PCR. (C) Transmembrane invasion assay (P‐values determined by Student’s t‐test). EMT, epithelial–mesenchymal transition. Error bar = SEM.