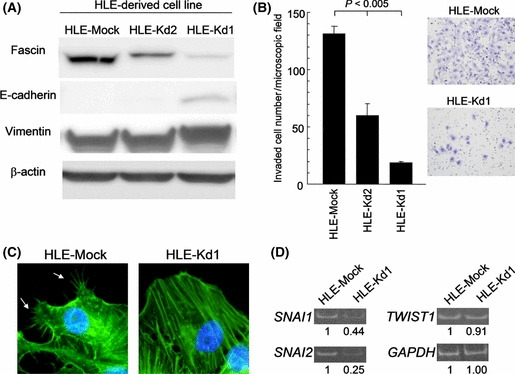
Figure 3.

Characterization of HLE‐derived fascin‐1 knockdown cell lines HLE‐Kd1 and HLE‐Kd2. HLE‐Mock is a negative control transfected with the vector only. (A) Western blot analysis. (B) Transmembrane invasion assay. A fascin‐1 dose‐dependent increasing trend of invasion efficiency is statistically evident (P < 0.005 by the Jonckheere–Terpstra trend test). The photographs show invaded HLE‐Mock and HLE‐Kd1 cells. Error bar = SEM. (C) Fluorescently labeled phalloidin staining of actin filaments in HLE‐Mock and HLE‐Kd1 cells. Typical filopodial extensions of HLE‐Mock cells, indicated by white arrows, are not evident in HLE‐Kd1 cells. (D) Representative results of semiquantitative RT‐PCR. The numerical values are relative expression levels.
