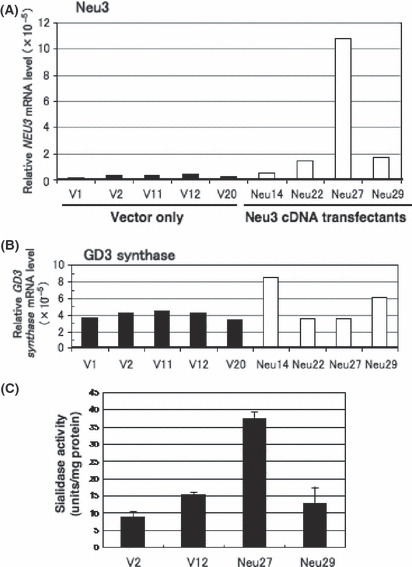
Figure 2.

Overexpression of NEU3 cDNA in SK‐MEL‐28. (A) Relative mRNA levels of NEU3 as analyzed by quantitative RT‐PCR using RNA extracted from five controls and four transfected cell lines of a NEU3 expression vector. (B) Relative mRNA levels of GD3 synthase mRNA in individual control and transfectant lines as shown in (A). (C) Sialidase activity in NEU3 transfectants. Sialidase activity in cell extracts was assayed with gangliosides as substrates.
