
Figure 2.
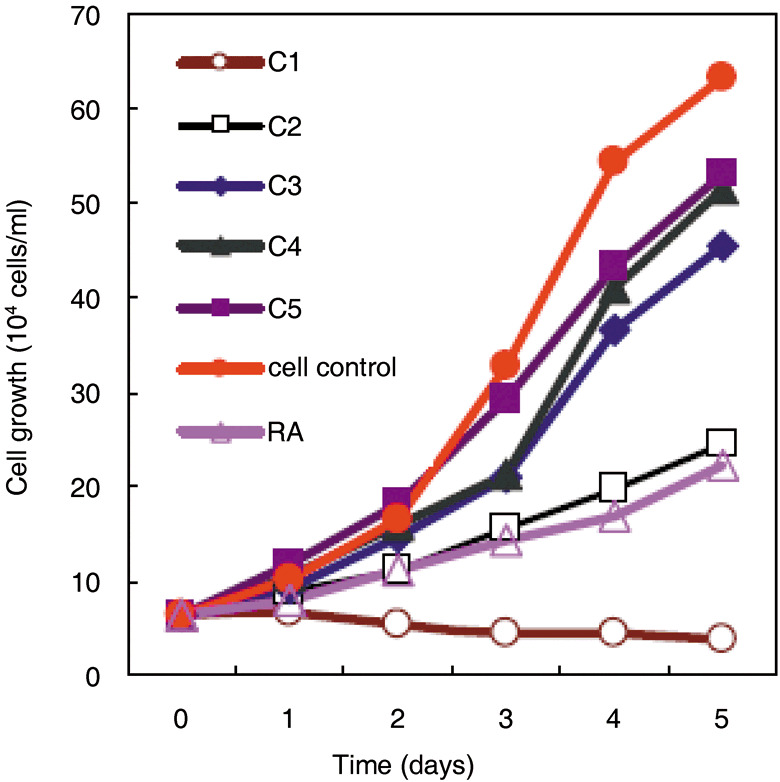
The effect of wogonin on the growth of NB4 cells compared with all‐trans retinoic acid (ATRA). Cells were treated with different concentrations of wogonin or 1 µM ATRA for 5 days. Values are means ± SD of three parallel experiments. C1–C5 are different concentrations of wogonin used and correspond to 100, 50, 10, 1.0, and 0.1 µM, respectively.