
Figure 2.
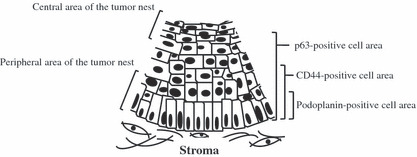
Schema of the hierarchical distribution pattern of podoplanin, CD44, and p63 within tumor nests. The distribution of podoplanin‐positive cells appeared to be more localized to the peripheral area of the tumor nests than the distribution of CD44‐ and p63‐positive cells. The distribution of p63‐positive cells was broader than that of the CD44‐positive cells.