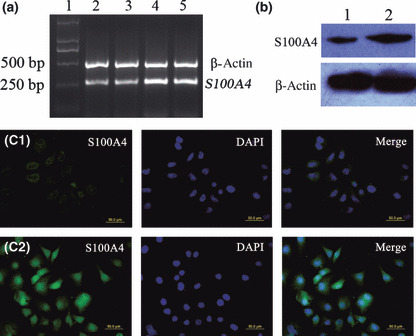
Figure 1.

Effects of real hypoxia (2.5% O2) on S100A4 expression and subcecullar distribution of S100A4 protein. BGC823 gastric cancer cells were cultured under hypoxic conditions (2.5% O2), and S100A4 mRNA and protein expression were analyzed by RT‐PCR (a), western blot analysis (b), and immunofluorescence staining (c) as described in the Materials and Methods. (a) Lane 1: M, DNA marker – DL2000; Lane 2: sample from untreated cells; Lanes 3 to 5: samples representing 6, 24, and 48 h after exposure to hypoxia, respectively. (b) Lane 1: sample from untreated cells; Lane 2: sample representing 24 h after exposure to hypoxia. (c) C1, C2: samples representing untreated cells, 24 h after exposure to hypoxia, respectively. The primary antibody used in this experiment was anti‐S100A4 antibody (green). DAPI was used to visualize nuclear staining (blue). Merged images of green and blue signals are shown in the right panels.
