
Figure 2.
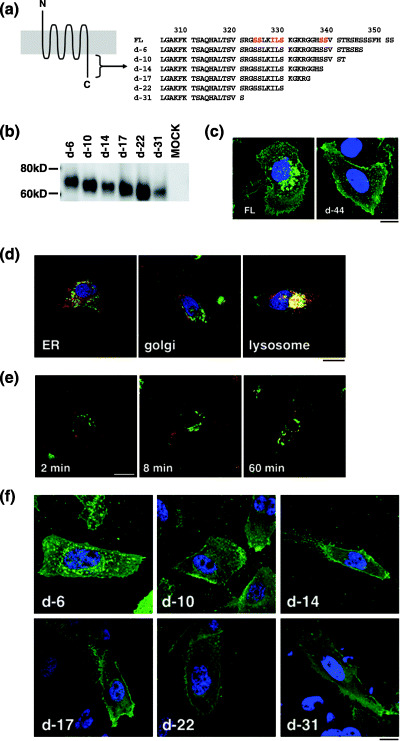
Expression profiles of CXCR4 and a mutant with cytoplasmic tail deletion. (a) Schematic representation of CXCR4. The N‐terminus CXCR4 is exposed in the extracellular space and the C‐terminus is intracellular. Gray represents the lipid bilayer. The amino acid sequence of the cytoplasmic tail is shown. Residues in red are required for ligand‐induced endocytosis. The CXCR4 d‐44 mutant lacks amino acid 309–351. (b) Schematic representation and Western blot of FL and d‐44 constructs. (c) Flow cytometry profiles of FL and d‐44 expressed in 293T cells. The horizontal axis represents green fluorescence intensity indicative of green fluorescent protein (GFP)‐tagged CXCR4 protein levels, and the vertical axis is PE‐Cy5 fluorescence intensity, reflecting cell surface CXCR4 detected by the anti‐CXCR4 antibody. GFP‐positive cells expressing FL are colored in red (left) and those expressing d‐44 in green (middle). The expressional differences between FL and d‐44 is highlighted on the overlay plot (right).