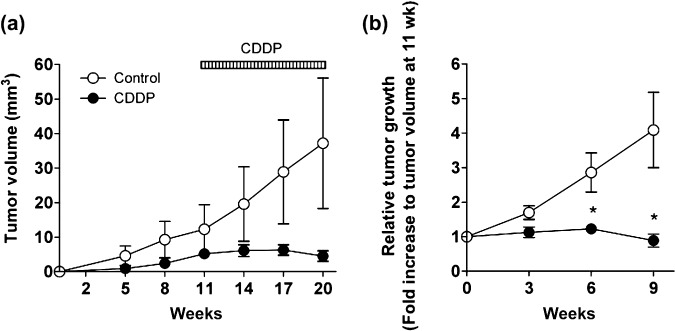
Figure 6.

Effect of chemotherapy on solitary lung tumor growth in K‐rasLSL–G12D/p53LSL–R270H mice quantified by microcomputed tomography (micro‐CT). Summary of quantitative analysis of micro‐CT imaging, presented in Figure 5, is shown. (a) The growth curve of lung tumor in K‐ras/p53 mice. (b) Relative tumor size to prescanned tumor (at 11 weeks post recombinant adenovirus expressing Cre recombinase [Ade‐Cre] infection) in K‐ras/p53 mice. Data represent mean ± SEM.
