
Figure 2.
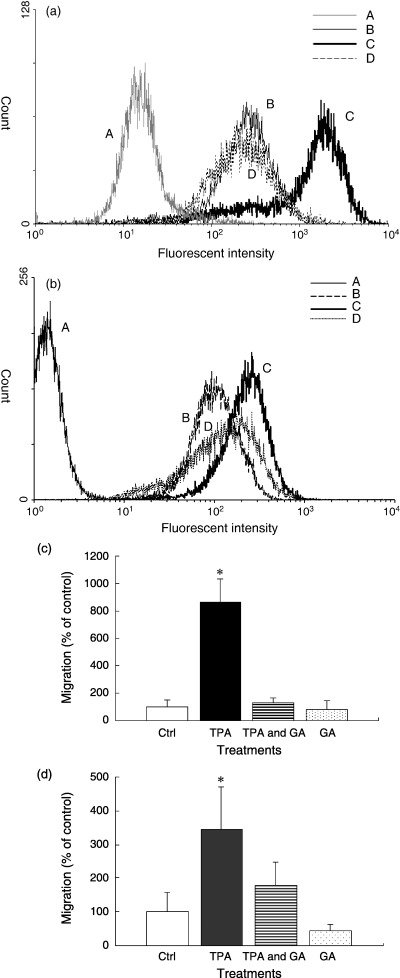
Characteristic evaluation of differentiation in HL‐60 cells. (a) Flow cytometric analysis of CD13 in HL‐60 cells. To measure CD13 expression, HL‐60 cells (A and B: untreated cells, C: tetradecanoylphorbol‐13‐acetate (TPA)‐treated cells, D: TPA + geldanamycin‐treated cells) were grown for 7 days in the presence or absence of different drugs (TPA: 1 nM, geldanamycin: 200 nM). Cells (B, C, and D) were then labeled with phycoerythrin‐conjugated anti‐human CD13 mouse monoclonal antibody or control IgG (A) and analyzed by a Becton Dickinson FACSCalibur. (b) Effect of 17‐(allylamino)‐17‐demethoxygeldanamysin (17‐AAG) on TPA‐induced CD13 expression (A and B: untreated cells, C: TPA‐treated cells, D: TPA +17‐AAG‐treated cells) were grown for 48 h in the presence or absence of different drugs (TPA: 10 nM, 17‐AAG: 20 nM). Cells (B, C, and D) were then labeled with PE‐conjugated anti‐human CD13 mouse monoclonal antibody or control IgG (A) and analyzed. (c) Invasiveness of cultured HL‐60 cells with low‐dose/long‐term TPA treatment through Matrigel. Untreated HL‐60 cells, TPA‐treated cells (1 nM, 7 days), TPA + geldanamycin‐treated cells (TPA 1 nM, geldanamycin 200 nM, 7 days), and geldanamycin‐treated cells (200 nM, 7 days) were compared. (d) Invasiveness of cultured HL‐60 cells with high‐dose/short‐term TPA treatment through Matrigel. Untreated HL‐60 cells, TPA‐treated cells (100 nM, 1 h), TPA + geldanamycin‐treated cells (TPA 100 nM, geldanamycin 2 mM, 1 h), and geldanamycin‐treated cells (2 mM, 1 h) were compared. The results were expressed as a percentage of the control. Data are mean ± SD. *P < 0.05, compared with the control. The results were expressed as percent of the control. Data are mean ± SD. *P < 0.05, compared with the control.