
Figure 5.
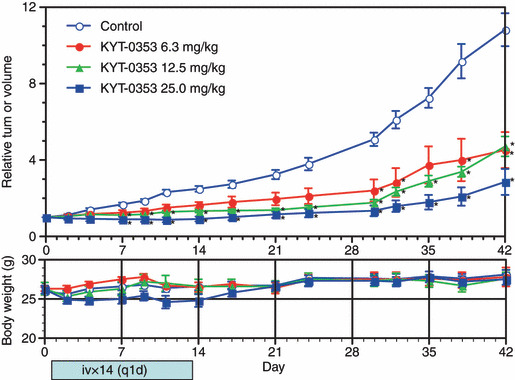
Effects of KYT‐0353 on the growth of transplanted HT‐29 tumors and body weights in nude mice. Blocks were prepared from HT‐29 tumors and transplanted through a transplantation needle to the right flank of male nude mice. The mice were divided into one control group (n = 10) and treatment groups (n = 6). Test compound was intravenously administered from the day of grouping (day 0) once daily for 14 days. The tumor volume and body weight were measured two or three times a week for 42 days. The tumor volume was expressed as relative to the initial tumor volume. The growth inhibition ratio was obtained from the mean relative tumor volume of each treatment group to the mean relative tumor volume of the control group. The upper graph shows tumor volume changes with relative tumor volumes on the ordinate and days after the initiation of treatment on the abscissa. The lower graph shows body weight changes with body weights on the ordinate and days after the initiation of treatment on the abscissa. The symbols indicate relative tumor volumes of ○ the control, • 6.3 mg/kg, 12.5 mg/kg, 25.0 mg/kg treatment groups with perpendicular bars of SEM. The symbol * signifies points of a statistical significance of difference with one‐sided risk of 1% in the Mann–Whitney U‐test.