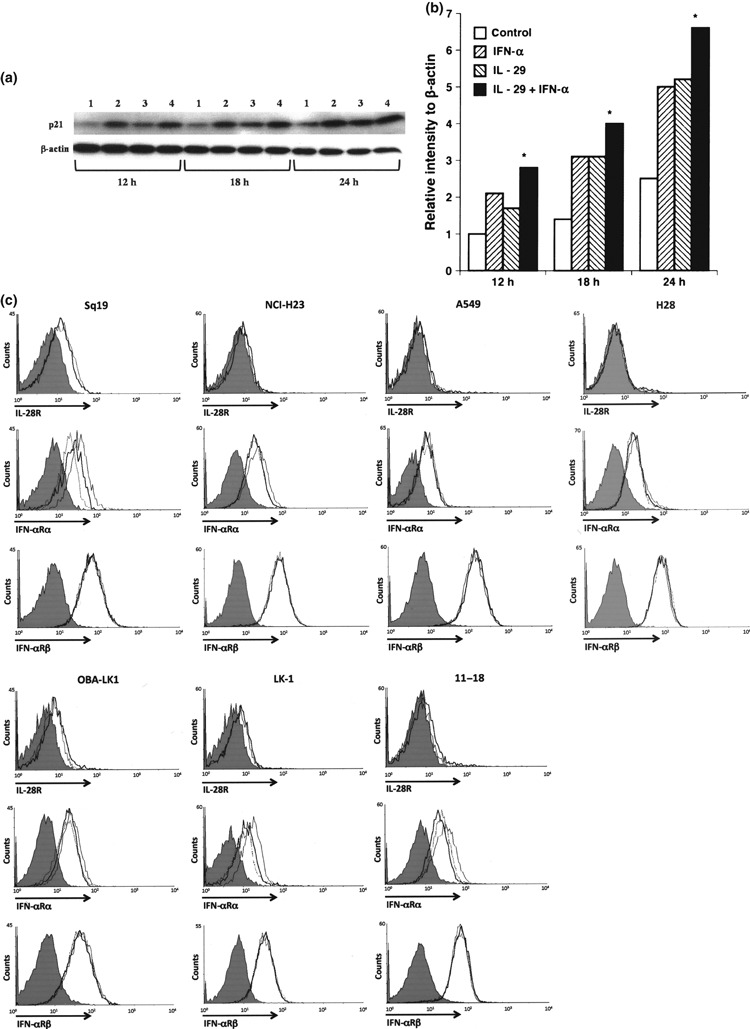
Figure 9.

Biological effect of the combination of interleukin (IL)‐29 and interferon (IFN)‐α on p21 expression, and regulation of IL‐28R and IFN‐αRα expression with type III and type I IFN. (a) LK‐1 cells were cultured with or without interferon(s) for the indicated hours. Time course analysis of p21 induction was performed using western blot analysis. 1, control; 2, 10 ng/mL IFN‐α; 3, 50 ng/mL IL‐29; and 4, 50 ng/mL IL‐29 plus 10 ng/mL IFN‐α. (b) The relative p21 intensity normalized to β‐actin is presented in the bar graph (*P < 0.05: IFN‐α or IL‐29 vs IL‐29 plus INF‐α). (c) To examine the surface expression of IL‐28R, cells were treated with 50 ng/mL IFN‐α (bold line) for 24 h, harvested and washed twice with PBS containing 0.1% NaN3. Cells were also cultured without stimulation (thin line). To examine the surface expression of IFN‐αRα or IFN‐αRβ, cells were treated with 50 ng/mL IL‐28A (dotted line) or 50 ng/mL IL‐29 (bold line) for 24 h, harvested and washed twice with PBS containing 0.1% NaN3. Cells were also cultured without stimulation (thin line). Cells (1 × 10⁶) were incubated with anti‐human IL‐28R mAb, anti‐human IFN‐αRα mAb, anti‐human IFN‐αRβ mAb or with isotype control (grey shade). After washing three times with PBS, the cells were incubated with PE‐conjugated goat anti‐mouse IgG F(ab)2.
