
Figure 4.
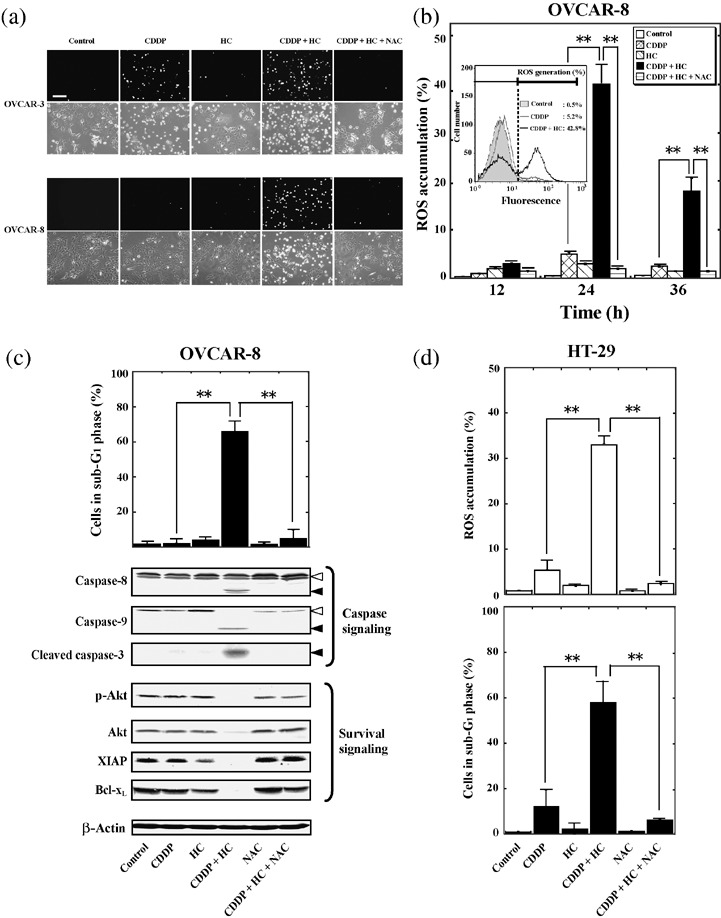
HC‐toxin enhances the cisplatin‐induced accumulation of reactive oxygen species (ROS). (a) OVCAR‐3 or OVCAR‐8 cells were incubated for 24 h with 30 µM cisplatin, 0.1 µM HC‐toxin, or both agents in the absence or presence of 10 mM N‐acetyl‐L‐cysteine (NAC), as indicated. The accumulation of ROS was then examined using fluorescence staining with the ROS‐sensitive dye CM‐H2DCFDA. Both fluorescence (upper rows) and phase‐contrast (lower rows) images are shown. Bar = 200 µm (b) OVCAR‐8 cells were incubated for the indicated times as in (a), after which the cells were labeled with CM‐H2DCFDA and analyzed using flow cytometry to determine the percentage of cells manifesting ROS accumulation. (Inset) Flow cytometric traces for cells incubated for 24 h in the absence or presence of cisplatin with or without HC‐toxin. Cells showing a rightward shift of the histogram were considered to manifest an increase in ROS generation. (c) OVCAR‐8 cells were incubated for 48 h as in (a), after which the proportion of cells in sub‐G1 phase was determined using flow cytometry (upper panel), or cell lysates (30 µg of protein) were subjected to immunoblot analysis with antibodies to the indicated proteins (lower panels). Open arrowheads indicate the uncleaved forms of caspase‐8 or caspase‐9; closed arrowheads indicate cleaved fragments of the respective caspases. (d) HT‐29 cells were incubated for 24 h (upper panel) or 48 h (lower panel) with 50 µM cisplatin, 0.1 µM HC‐toxin, or both agents in the absence or presence of 10 mM of NAC. The proportion of cells manifesting ROS accumulation (upper panel) or a fractional DNA content (lower panel) was then determined using flow cytometry. All qualitative data are representative of three separate experiments. All quantitative data are means ± SD from three separate experiments, each performed in duplicate. **P < 0.001.