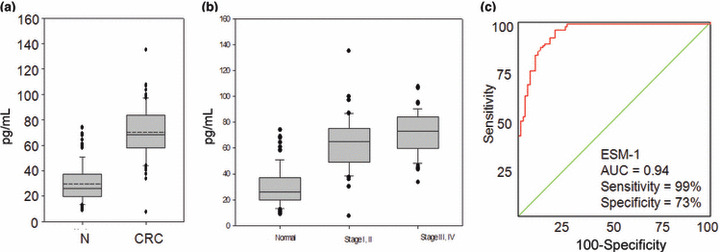
Figure 4.

Serum concentration and receiver operating characteristics (ROC) curve of endothelial cell‐specific molecule‐1 (ESM‐1). (a) Serum ESM‐1 concentrations in normal subjects (N) and in patients with colorectal cancer (CRC). (b) Serum concentrations of ESM‐1 in normal samples (normal), patients with early stage CRC (stages I and II), and those with late stage CRC (stages III and IV). The horizontal line inside the box is the mean, and the box represents the lower and upper quartiles. The whiskers indicate the 95% confidence interval of the values. The values outside the whiskers represent individual outliers. (c) The ROC curves for ESM‐1 in serum samples collected form healthy subjects and CRC patients. In a ROC curve the true positive rate (sensitivity) is plotted in function of the false rate (1‐specificity) for different cut‐off points. Each point on the ROC plot represents a sensitivity/specificity pair corresponding to a particular decision threshold. A test with perfect discrimination has a ROC plot that passes through the upper left corner (100% sensitivity, 100‐specificity). Therefore the closer the ROC plot is to the upper left corner, the higher the overall accuracy of the test.
