
Figure 1.
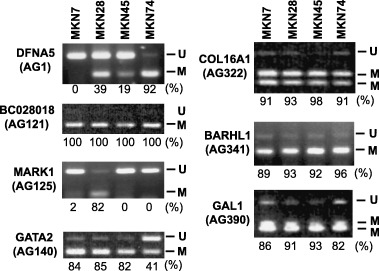
Methylation analysis of genes identified by methylated CpG island amplification coupled with representational difference analysis. Combined bisulfite restriction analysis was carried out using primers that amplify the region around the transcription start site of the genes. The cell lines examined are shown at the top; the genes and clones analyzed are shown on the left. The relative percentages of methylated alleles are shown below the columns.