
Figure 5.
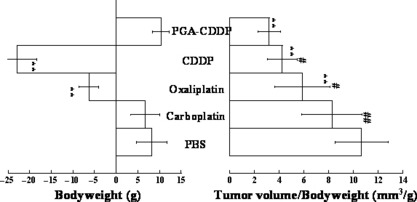
Tumor volume/body weight in BALB/cA nude mice following 2 weeks of therapy. Proportionality in tumor volume/body weight changes was evaluated as gross efficiency after tumor therapy; each of the data in tumor volume (Fig. 3b) was divided with each of the data in body weight (Fig. 4b) in the BALB/cA nude mice. Data are presented as the mean ± SD (n = 7). *P < 0.05 drugs vs control. **P < 0.01 drugs vs control. #P < 0.05 γ‐PGA‐CDDP vs other drugs. ##P < 0.01 γ‐PGA‐CDDP vs other drugs.