
Figure 2.
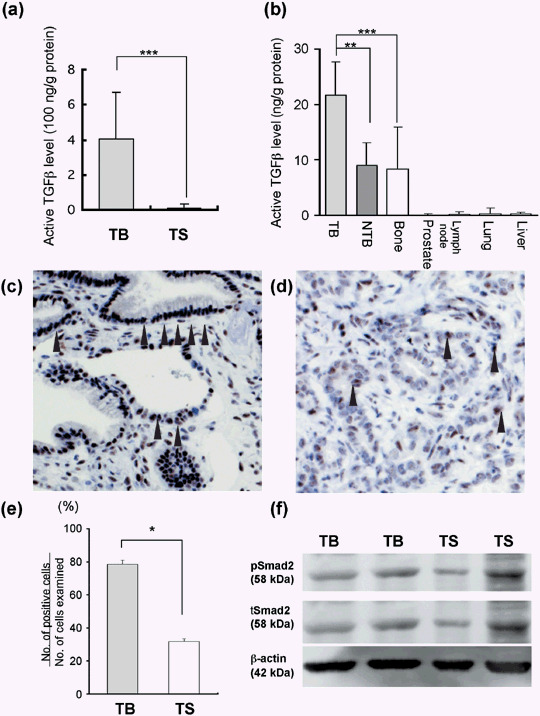
Transforming growth factor β (TGFβ) level and signaling at the tumor–bone (TB) and the tumor–subcutaneous (TS) interfaces in prostate tumors transplanted onto cranial bone and into the subcutis of male rats. (a) TGFβ level at the TB‐interface and the TS‐interface evaluated by enzyme‐linked immunosorbent assay. Data are mean ± SD from values for five samples. ***P < 0.001. (b) TGFβ level in several organs. (c,d) Immunostaining of phosphorylated Smad2 (pSmad2) at the TB‐interface (c) and the TS‐interface (d). The nuclei of pSmad2‐positive tumor cells are stained (arrowhead). (e) pSmad2‐positive tumor cell index evaluated by Image Processor for Analytical Pathology (Sumika Technos Corp., Osaka, Japan). *P < 0.05. (f) Western blot analysis of pSmad2 and total Smad2. Two different samples were loaded. NTB, non‐TB‐interface.