
Figure 1.
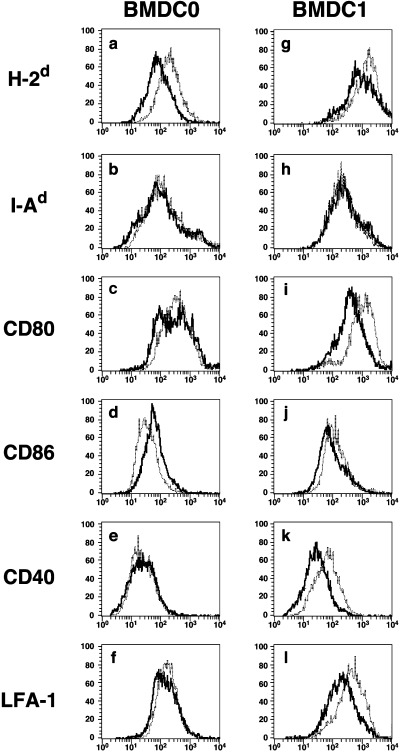
The expression of functional cell surface molecules on BMDC1 was greatly downmodulated by VitD3. (a–f) BMDC0 and (g–l) BMDC1 were generated from bone marrow cells by culture under distinct culture conditions with or without VitD3. Expression of cell surface molecules ([a,g] H‐2d, [b,h] I‐Ad, [c,i] CD80, [d,j] CD86, [e,k] CD40 and [f,l] leukocyte function‐associated antigen [LFA]‐1) was determined by flow cytometry. The data indicate the staining profile of BMDC subsets generated in the presence (–––) or absence (. . .) of VitD3. Similar results were obtained in three different experiments.