
Figure 3.
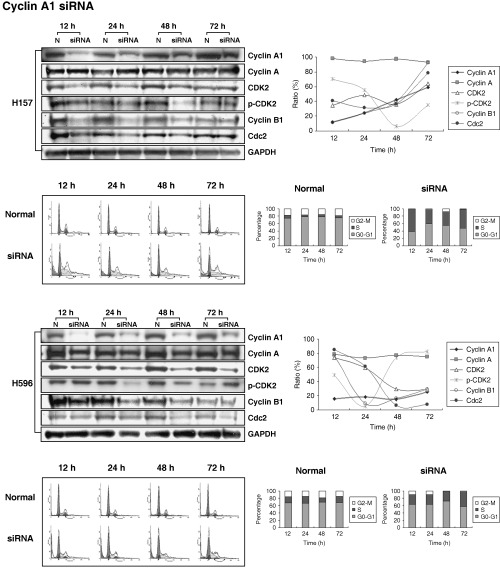
Reduction rate of target genes in lung cancer cell lines with cyclin A1 RNAi. All cell lines demonstrated a marked decrease in cyclin A1 protein levels after 12–24 h, however, the effect of siRNA on cyclin A1 levels lessened after 48–72 h. The figure represents relative protein levels using quantification of Western blot analysis, standardized to GAPDH. Each value was obtained from the ratio of the corresponding normal value (P < 0.05). H157: lanes 1, 3, 5 and 7 represent samples at 12, 24, 48 and 72 h after negative control siRNA treatment, respectively; lanes 2, 4, 6 and 8 represent samples at 12, 24, 48 and 72 h after cyclin A1 siRNA treatment. H596: lanes 1, 3, 5 and 7 represent samples at 12, 24, 48 and 72 h after negative control siRNA treatment, respectively; lanes 2, 4, 6 and 8 represent samples at 12, 24, 48 and 72 h after cyclin A1 siRNA treatment. DNA histogram demonstrates the influence of cyclin A1 and cyclin B1 siRNA on cell cycle fractions. This figure compares the S and G2/M phase fraction of cyclin A1 RNAi treated group and the negative control group. Notice the decreased S phase fraction in both lung cancer cell lines. H157: the S phase percentages were 61.27%, 35.97%, 35.46% and 51.91% at 12, 24, 48 and 72 h after siRNA for cyclin A1, respectively; H596: 24.51%, 25.59%, 29.95% and 39.52% at 12, 24, 48 and 72 h after cyclin A1 siRNA treatment, respectively.