
Figure 3.
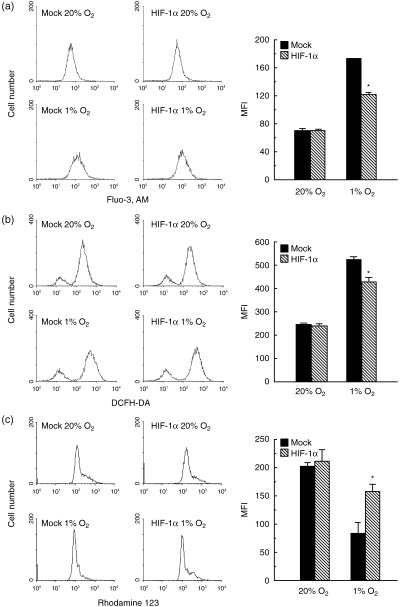
The [Ca2+]i, generation of ROS and Δψm in control cells and HIF‐1α‐overexpressing cells. Both cell types were cultured under normoxic and hypoxic conditions for 24 h. (a) [Ca2+]i was determined by the fluorescence obtained from Fluo‐3 AM using a FACScan cytometer. (b) ROS levels were measured using flow cytometry after loading cells with DCFH‐DA. (c) Δψm was measured by the relative fluorescence intensities of rhodamine‐123 using flow cytometry. The experiment was repeated three times and this is a representative example. Values are the mean ± SEM of determinations made in three independent cultures. *P < 0.05 compared with values for control cells (mock).