Figure 1.

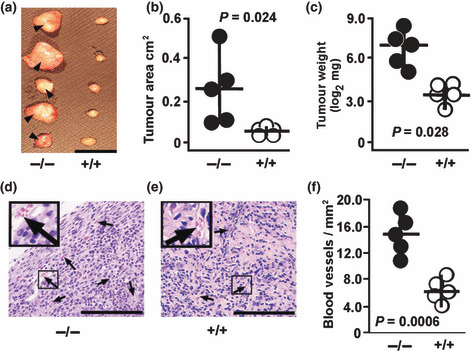
TC‐1 tumor growth in Nas1−/− and Nas1+/+ mice. (a) Representative photograph showing increased tumor size in Nas1−/− mice (n = 5) when compared to Nas1+/+ mice (n = 5). Blood vessels were observed on the tumors from Nas1−/− mice (arrowhead) but not from Nas1+/+ mice. Bar, 1 cm. The individual (n = 5 per group) (b) tumor cross‐sectional areas and (c) weights and medians, ranges, and P‐values from the Student’s t‐test are shown. (d,e) Representative photomicrographs showing an increased number of tumor vessels in Nas1−/− mice (n = 5) when compared to Nas1+/+ mice (n = 5). Bar, 200 μm. (f) Individual (n = 5 per group) vessel densities, medians, ranges, and P‐values from the Student’s t‐test are shown. Photographs and data are representative of three experiments.
