
Figure 2.
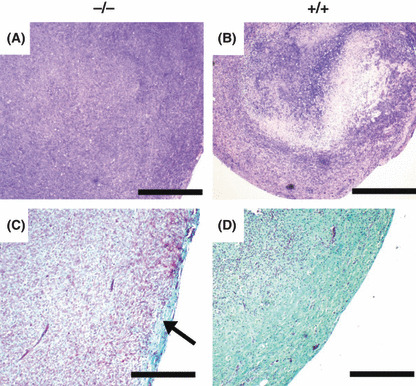
Histological assessment of tumors from Nas1−/− and Nas1+/+ mice. (a,b) Representative photomicrographs (n = 5 per group) showing necrosis in the core of tumors from Nas1+/+ mice, but not in Nas1−/− mice. Bar, 2 mm. (c,d) Representative photomicrographs (n = 5 per group) showing collagen staining primarily in the peripheral region (arrow) of tumors from Nas1−/− mice, whereas abundant staining was detected throughout the tumors from Nas1+/+ mice. Bar, 1 mm.