Figure 4.

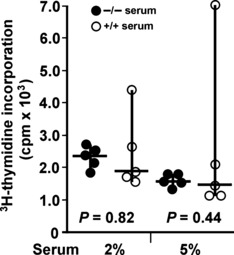
Growth assessment of cultured TC‐1 cells supplemented with 2 or 5% serum from Nas1−/− and Nas1+/+ mice. Individual cpm values (mean of triplicate cultures), median, range, and P‐values from the Student’s t‐test are shown.

Growth assessment of cultured TC‐1 cells supplemented with 2 or 5% serum from Nas1−/− and Nas1+/+ mice. Individual cpm values (mean of triplicate cultures), median, range, and P‐values from the Student’s t‐test are shown.